Quantcast
Channel: PulmCrit: Pulmonary Intensivist's Blog
Viewing all 104 articles
Browse latest View live

Dear NEJM: We both know that conflicts of interest matter.

$
0
0

Introduction

Recently the New England Journal of Medicine launched a media campaign challenging the negative perception of industry conflicts of interests (COI).  This was surprising, because it is the opposite of what editors of the NEJM have previously reported (see above books by former NEJM editors, published in 2004 and 2005).  Big pharma hasn't reformed dramatically in the last decade.  So why the change of heart?

History of the NEJM & COI

Some context is helpful.  In 1996, the NEJM editors Drs. Angell and Kassirer made it official policy of the journal that reviews and editorials could never be written by authors with financial COIs (Angell 1996).  However, these editors both left the NEJM, possibly related to a disagreement with their publisher's plans to use the NEJM's brand to promote other sources of healthcare information (Smith 2006).  Subsequently, Dr. Drazen was appointed as editor-in-chief of the NEJM in 2000, despite concern that he had ties to numerous drug companies (Sibbald 2000, Gottlieb 2000).  In 2002 the NEJM changed its policy toward COIs, allowing editorials and reviews to be written by authors with "insignificant" financial COIs (defined as <$10,000 per year from industry)(Drazen 2002). 

This policy reversal is best described by Dr. Kassirer:
"During the decade of the 1990s, when I was editor-in-chief of the New England Journal of Medicine, we rejected anyone who had a conflict of interest from writing an editorial or review article.  Sometimes it required going down the list until we found someone who didn't have a conflict, but we never had to compromise and accept someone without sufficient expertise to do a good job.  I also think it's often a good idea to get someone who isn't too close to the action:  it often avoids "group think" and provides a fresh perspective.  But to maintain our 1990s policy takes more work because you can't just accept the first person who pops into your mind.  I was disappointed when the journal changed the policy, and said so publicly."
 - Kassirer JP, British Medical Journal 2001
The current media campaign is a continuation of the direction that the NEJM set forth in 2002.  Perhaps the campaign represents a response to the British Medical Journal, which recently announced a new "zero tolerance" policy in which no financial COIs will be allowed for authors of editorials or reviews (Chew 2014). 


Current media campaign in the NEJM

This has consisted of a three-part series of articles by Dr. Rosenbaum, an editorialby NEJM editor-in-chief Dr. Drazen, and a reader poll.  The overall message is that we have grown overly suspicious of big pharma and COIs.  "We have forgotten that industry and physicians often share a mission - to fight disease."

Although Dr. Rosenbaum's articles make some valid points, they are quite one-sided.  Dr. Rosenbaum is a correspondent for the NEJM, so it is no coincidence that her articles are strongly supportive of the current policy initiatives of the NEJM.  Ironically, this exemplifies the significance of COIs.  Although it is impossible to know how much her position may have affected her perspective, her COI naturally challenges her unbiased opinion on the matter.

Perhaps the most interesting component of the media campaign is the reader poll about the adequacy of various hypothetical authors for a review article.  Three potential authors are described, all of whom have significant COIs.  The design of this poll itself is biased, by presenting no authors without COIs.  A more transparent approach might be to simply ask readers "do you think review article authors should be allowed to have COIs?" 

Industry funding of NEJM

The NEJM itself has significant financial conflicts of interest.  This may not come primarily from print and electronic advertisements by drug companies, but rather from industry purchases of article reprints.  For example, if the NEJM publishes an article supporting a new drug, the drug company will often purchase thousands of reprints of the article.  The NEJM makes a large profit margin from the reprints.  For example, Merck purchased 929,400 reprints of the infamous VIGOR trial of Vioxx, yielding an estimated income for the NEJM of $697,000 (Marcovitch 2012).  The Lancet editor Dr. Richard Horton reported that companies may promise to purchase a large order of reprints in return for publication of a favorable study.

It is impossible to determine how much money the NEJM makes from reprints.  Although the BMJ and Lancet disclosed their income from reprints, the NEJM and JAMA have not done so (table above).  Between 2005-2006, the sale of reprints contributed 41% of the total income of the Lancet.  The NEJM likely receives more revenue than the Lancet from reprints, given that it publishes more industry-supported studies than the Lancet (table below).  Combining revenue from advertising and reprints, it is likely that the NEJM receives most of its revenue from industry. 


In 2008, Dr. Drazen favorably reported the revenue from industry in a meeting of the Massachusetts Medical Society (publisher of the NEJM), saying "The results in recruitment advertising and bulk reprints were outstanding this year;  They went a long way to offset declines in print-based revenue that all publishers are experiencing." (BMJ 2011).

Conflicted nature of medical publishing

Like drug companies, medical journals have a conflicted set of incentives (Marcovitch 2010).  Certainly, any journal has lofty philosophical goals such as improving medical care.  However, the journal is also a news organization, and as such may be drawn to the hottest news stories.  Finally, any journal functions within a business model, requiring sufficient revenue to stay solvent. 
  

These incentives may be conflicting.  For example, journals often tout their impact factor, a measurement of how well they are read and cited.  Less publicized is the frequency of article retractions.  Compared to other journals, the NEJM has both the highest impact factor and also the highest frequency of retractions (Fang 2011).  This suggests that in the pursuit of hot articles, corners are sometimes cut.


Managing COI: Who should write review articles and guidelines?

There are two general concepts for approaching the authorship of NEJM review articles (and guidelines in general).  The traditional approach is the subject matter expert model (below).  In this model, a handful of experts are involved in performing industry-funded research.  These experts, who usually develop some COIs, are also involved in authorship of guidelines and NEJM review articles.  This is the model which the NEJM is currently promoting.  For example, in his editorial Dr. Drazen reflected on the virtues of a simpler time in the 1940s when a single investigator could discover and market streptomycin, and then write a major review article on the same topic.


A newer approach might be described as a COI-free model (above), wherein guidelines and NEJM review articles are authored by experts without COIs.  Since investigators are often involved in industry-funded research and frequently have COIs, this would mean that prominent investigators would often be excluded from authoring guidelines and review articles in the NEJM.  As discussed above, this approach requires more work because qualified experts without COIs must be sought.  However, unbiased experts will provide fresh perspectives which add diversity to the field. 

A recent example of these two models was the evolution of the American College of Emergency Physicians (ACEP) clinical policy regarding ischemic stroke.  Initially, a policy was drafted as a joint document with the American Academy of Neurology, including authors with COIs.  The first version was very enthusiastic about the use of TPA (giving it a Level A recommendation within the 0-3 hour window).  This policy, and concerns about COIs, caused an uproar.  ACEP consequently broke away from the American Academy of Neurology and went back to the drawing board to design an entirely new policy authored solely by experts without any COIs.  The new policy is generally felt to be a major improvement compared to the initial policy, with less bias and more focus on the evidence.

Is there a shortage of authors for review articles?

The argument for allowing authors with COIs to write NEJM review articles is based on a reported shortage of eligible authors (as described in the 2002 NEJM policy statement here).  This is hard to believe.  For example, in the USA alone there are >150,000 active full-time faculty employed by medical schools.  Any of these faculty would probably be honored to write a review article for the NEJM, and many thousands of them are qualified.

Conclusions

The recent NEJM campaign in support of industry is partially correct:  COIs are not necessarily evil, and people with COIs include many brilliant researchers and clinicians.  Certainly physicians and pharma need to work together to develop new drugs, with patients often benefitting from such collaboration. 

However, there is no shortage of unbiased experts without COIs to write NEJM review articles and consensus guidelines.  Choosing physicians without COIs for these tasks makes sense.  This would avoid bias or the appearance of bias, thus bolstering trust in these sources.  As a clinician, I would be more interested in a review by an author without COI. 

Evaluating this issue exposes the fact that medical journals have significant COIs.  Journals often receive significant funds from drug companies in direct response to publishing industry-funded research (in the form of bulk reprints).  With the British Medical Journal and the NEJM moving in opposite directions on this issue, further examination of these differences is necessary.

Additional reading
  • No, Phramascolds are not worse than the pervasive conflicts of interest they criticize:  Larry Husten in Forbes
  • Medical journals are an extension of the marketing arm of pharmaceutical companies.  Smith R, PLOS Medicine 2005

Conflicts of Interest:  None. 

Image Credits: Image of physician obtained from http://www.cliparthut.com/doctor-symbol-clipart.html


Flash cigarette burns: To intubate or not to intubate?

$
0
0

Getting warmed up with a multiple-choice question

A 70-year-old man with oxygen-dependent COPD is admitted following a flash burn.   He started smoking with his oxygen running, and the cigarette “exploded” in his face.  Currently he is in the emergency department on four liters nasal cannula (twice his chronic oxygen prescription).   He is mentating well with a saturation of 93% and a respiratory rate of 15 breaths/minute.  He has first-degree burns on his lips and cheeks, with soot in his nares and singed nasal hairs.   What is the best immediate management for this patient?

(a) Immediate endotracheal intubation.
(b) Laryngoscopy to evaluate for upper airway, intubate if edema or blistering is seen.
(c) Bronchoscopy to evaluate entire airway, intubate if edema or blistering is seen. 
(d) Admit for observation.

Introduction

Education about airway injury in burn patients typically focuses on patients with smoke inhalation injury (e.g. following entrapment in a burning building).  Such patients are forced to inhale heated air, leading to a risk of delayed airway edema with difficult intubation.  Consequently, the approach to airway management in such patients often involves pre-emptive airway examination with intubation if there are signs of airway involvement.

Flash cigarette burns are entirely different.  A flash cigarette burn is used here to refer to when a patient on home oxygen lights up a cigarette, leading to a very exuberant but self-limited combustion of the cigarette in their face.  These fires are brief and self-contained, with primarily superficial damage.  The injury often appears misleadingly severe (i.e. face covered in soot, with singed nasal hairs).  Given a different mechanism of injury compared to other types of burns, the clinical approach should likely be different as well. 

The Evidence

Amani H et al.  Assessing the need for intubation in patients sustaining burn injury secondary to home oxygen therapy.  Journal of Burn Care & Research 2012.

This is a retrospective chart review study of 86 patients with burns associated with home oxygen between 2000-2010.  87% of these patients suffered burns while lighting a cigarette, with other causes including candles, sparks, and gas stoves.  The percent total body surface area involved ranged from 0.5-15%. 

Most patients (61%) were not intubated.  Among intubated patients, bronchoscopy revealed airway edema in 22%.  Most intubations occurred in the field or outside hospital, with only eight patients intubated in the ED of the burn center and one patient intubated in the ICU (for an exacerbation of asthma).  

This study is limited because it evaluates a heterogeneous group of patients (combining flash cigarette burns with more serious burn injuries).  Another limitation is that the indication for intubation in most cases was unclear, so it is unknown whether patients truly required intubation.  

Regardless, a few points are notable.  Most patients didn’t require intubation, and the great majority had no airway edema.   Perhaps more importantly, there was no evidence of delayed airway swelling:  only one patient required intubation in the ICU due to asthma exacerbation.  The authors came to the following conclusions:

“Health care providers with limited or infrequent exposure to the treatment of burn patients with singed facial and nasal hair often interpret these physical findings to be consistent with the presence of a possible inhalation injury.   This often results in unnecessary intubation in a patient who demonstrates no signs of respiratory distress or, as in a patient with COPD, no change in respiratory status from baseline.”

Muehlberger T et al.   Domiciliary oxygen and smoking:  an explosive combination.   Burns 1998.

This is a retrospective chart review of 21 patients with burns due to lighting a cigarette on oxygen therapy between 1990-1997 at John Hopkins Hospital.  Seventeen patients were using oxygen via nasal cannula, with four patients using a facemask.  Seventeen patients had second-degree burns, four patients had full-thickness burns, and two patients required skin grafting.  Nonetheless, no patients had an inhalational injury or required intubation.

Patient image from Muehlberger et al.   

This is a useful study because it examines only patients with flash cigarette burns.  When managed at a referral center with extensive experience treating burns, none of these patients required intubation. 

Vercruysse GA et al.  A rationale for significant cost savings in patients suffering home oxygen burns:  Despite many comorbid conditions, only modest care is necessary.  Journal of Burn Care & Research 2012.

This is a retrospective study of 64 patients admitted with burns sustained while using home oxygen therapy between 1997-2010.  92% of burns were due to cigarettes.  Intubation predominantly occurred prior to transfer to the burn center, with 28% of transferred patients arriving intubated.  An additional two patients were intubated in the emergency department prior to evaluation by the burn service.   Among all intubated patients, 80% were extubated within eight hours of admission and 100% were extubated within 24 hours of admission. 

This is an interesting study.  Given that most patients were extubated very rapidly, it is unlikely that they truly required intubation.  Furthermore, for a patient intubated pre-emptively, this data suggests that it is safe to pursue rapid extubation.  

Answering to the introductory question 

Choice (D) may be best (observation).  For patients with severe smoke inhalation injury (e.g. due to being trapped in a burning building), there is a risk of delayed airway edema with subsequent airway crisis.  Therefore, an aggressive approach to the airway is typically recommended with airway inspection and pre-emptive intubation if there is evidence of airway edema or blistering.  However, patients with flash cigarette burns do not appear to develop delayed airway edema.  Therefore, there is no indication for airway inspection or pre-emptive intubation.  

Conclusions 

Flash burns due to rapid combustion of a cigarette (sometimes with ignition of the patient’s nasal cannula as well) are typically relatively benign.  Skin grafting is only rarely required, with topical care usually being sufficient for management of the burn.  The rate of airway edema is low, and there does not appear to be a risk of delayed airway swelling or airway loss.

Pre-emptive intubation of these patients is not indicated.   Although these patients invariably have singed nasal hairs and soot in their nares, this is not an indication for intubation.  Airway management should be approached in these patients as it would be in other patients with chronic respiratory failure, with intubation only if clinically warranted (e.g. due to acute respiratory failure).   If the patient has already been intubated prophylactically, evidence supports aggressively weaning and extubating these patients.  

More on the anxiety-COPD vortex of badness here.
  
Most patients on home oxygen therapy have COPD, so a flash fire may cause bronchospasm with exacerbation of the patient’s lung disease.  Aggressive management with bronchodilators and perhaps low-dose corticosteroids may be helpful with this (e.g. prednisone 40 mg PO for five days).  Patients often have pain and anxiety related to their burns, which may cause tachypnea with worsening of gas trapping thereby aggravating their dyspnea (figure above).  Cautious use of opioids can be helpful to alleviate pain and anxiety.  Although facial burns will typically prevent application of noninvasive ventilation, the use of high-flow nasal cannula may be considered in selected patients with elevated work of breathing who do not require intubation (with very careful observation).


Overall, these patients may be approached with a focus on serial clinical assessment and common sense.  Surgical consultation is important to determine the need for skin grafting or other burn management.  From an airway and pulmonary standpoint, these patients should likely be approached similarly to other patients with chronic lung disease and respiratory dysfunction.  All efforts should be made to treat the lung disease, with intubation only if clinically warranted. 


  • Patients who have limited facial burns following a flash burn (from rapid combustion of a cigarette) typically do well with conservative therapy.  Skin grafting or intubation are only rarely required.
  • There is no role for pre-emptive intubation or routine airway examination for a patient with a limited flash burn.  If the patient has already been intubated pre-emptively, they should be aggressively weaned and extubated. 
  • Patients with a COPD exacerbation following a flash burn may be managed similarly to other patients with COPD exacerbation.   Attentive pain control will often go a long ways towards making these patients feel and look better.


CT Angiogram for evaluation of severe hematochezia

$
0
0
Introduction

Gastrointestinal hemorrhage is a common reason for ICU admission.  The approach to severe upper GI bleeding is relatively straightforward (figure below).  A predictable approach facilitates planning ahead, and anticipating who needs to be contacted for help when. 


Unfortunately, the approach to severe hematochezia is often less clear.  Below is a description of how these cases often unfold.  The diagnostic evaluation is frequently inconclusive.  Fortunately, most cases of lower GI bleeding are due to diverticulosis or angiodysplasia and these generally stop without specific intervention.


Building Blocks: Performance of various tests

Diagnostic Nasogastric Lavage

Historically, diagnostic NG lavage has often been over-utilized in a broad range of patients with GI bleeding.  For example, a recent article described the low yield of NG lavage in patients presenting with melena (Kessel 2015).  To confuse matters further, most studies of NG lavage have combined patients presenting with either melena or hematochezia.  Patients with an upper GI bleed presenting with hematochezia have a much brisker bleed than patients presenting with melena, and thus NG lavage might be expected to have a higher sensitivity in hematochezia.

Byers 2007 performed a prospective observational study of patients presenting to the emergency department with hematochezia who underwent NG lavage.  Among 114 patients, 10% had a positive lavage and this had a high specificity for correctly identifying an upper GI source as confirmed upon endoscopy.  Although this study does not define the sensitivity of NG lavage, it supports that NG lavage may have reasonable yield and high specificity in this context. 

The sensitivity of NG lavage among patients presenting with hematochezia has not been studied.  Based upon pooled studies of NG lavage of diverse presentations of GI bleeding, an estimate might be 50% (Palamidessi 2010).  Duodenal bleeding can be missed.  The specificity depends on the quality of material removed by the NG tube; a lavage demonstrating blood or coffee-grounds has a positive likelihood ratio of ~10 for upper GI bleeding (Srygley 2012). 

The primary drawback of NG lavage is that it is very uncomfortable, although this can be alleviated with topical anesthesia (e.g., see the ALIEM blog).  However, it has the advantages of being fast and inexpensive, with a reasonable yield and specificity (Anderson 2010). 

Esophagogastroduodenoscopy (EGD)

EGD is potentially one of the more important tests in evaluation and management of hematochezia.  10-15% of patients with severe hematochezia may have an upper GI source with rapid intestinal passage.  EGD has high sensitivity for identifying these patients and also allows for immediate therapy. 

EGD does not have perfect specificity due the rare occurrence of multiple sources of bleeding.  For example, a patient may have a minor gastric ulcer combined with active diverticular hemorrhage.  There may be a risk of finding the gastric ulceration and ceasing further diagnostic efforts ("satisfaction of search"). 

The main drawback of EGD is that it is an invasive test requiring conscious sedation, a gastroenterologist, and an endoscopy nurse.  Logistically this may take anywhere from 30 minutes to several hours to organize.  Given that most patients with hematochezia will nothave an upper GI source, this can cause significant delays in arriving at the correct diagnosis. 

Colonoscopy

Unlike the stomach and upper gastrointestinal tract, it is difficult to suction and clear the colon of blood and stool during active bleeding.  Therefore, for a critically ill patient with active hemorrhage, colonoscopy will often be impossible or nondiagnostic.  Some studies and guidelines recommend emergent colonoscopy for patients with lower GI bleeding, either without bowel preparation or following emergent preparation.  However, in our experience, this doesn't seem to work well and is not utilized for severehematochezia. 

Tagged RBC scan

Tagged RBC scan is frequently unhelpful.  Its use in an emergency is limited due to time required to set up the study and acquire images.  Even when it is positive, the image produced by extravasated blood is often unclear and doesn't locate the bleed with certainty.  Up to 25% of bleeding scans suggest an incorrect location of bleeding, due to rapid luminal migration of blood (Ghassemi 2013).  Tagged RBC scans have already been replaced by CT angiography at several centers (ASGE Guideline 2014). 

jjj
CT Angiography (CTA) 


Advances in multi-detector helical CT scanning have allowed for the development of an IV contrasted CT scan which is highly accurate for locating bleeding anywhere along the GI tract.  CTA typically consists of a series of three scans: an unenhanced CT scan of the abdomen, an arterial-phase contrasted CT scan, and a delayed venous-phase CT scan.  Together, these scans provide a wealth of information about the patient's anatomy and the location and character of any bleeding.  Meta-analysis revealed a sensitivity of 85% and specificity of 92% for identifying the bleeding source (Garcia-Blazquez 2013).  With severe active bleeding the performance is better (sensitivity >90%; Geffroy 2011) .  CTA has five major advantages compared to more traditional approaches:

(1) Detection and characterization of obscure bleeding sites

CTA has the ability to identify common sources of bleeding (both upper and lower) as well as more obscure sources of bleeding (e.g., aortoenteric fistula, small bowel sources, hemobilia).  It may also provide information characterizing an underlying lesion (e.g. identification of diverticula, tumors, etc.).  For example, the following images are from a CTA obtained in a patient with hemobilia due to a gangrenous gallbladder.  CTA localizes bleeding to the gallbladder and also characterizes underlying biliary and vascular pathology, expediting appropriate management (in this case, cholecystectomy). 


(2) Diagnosis of other abdominal pathologies that present with hematochezia

Patients presenting with hematochezia and shock are generally assumed to have hemorrhagic shock.  However, a variety of disorders can mimichemorrhagic shock, for example infectious colitis causing septic shock, ischemic colitis due to cardiogenic shock, or mesenteric ischemia causing systemic inflammatory response syndrome.  CTA will rapidly reveal these intestinal pathologies, immediately re-directing the management of these patients.


(3) Speed and availability

Aside from NG lavage, CTA is often the fastest and most available study.  Only intravenous contrast is utilized, so this test may be performed in the emergency department in under 10 minutes (Copland 2010).  For a critically ill patient, this may facilitate immediate triage to a curative procedure (e.g., angiography), rather than performing a series of time-consuming tests (e.g. EGD first, then tagged RBC scan second when EGD is negative, then angiography third).

"CTA should be the standard of care for assessment of patients presenting with acute lower GI bleed"
- Chan et al. 2014,  John Radcliffe Hospital, Oxford UK.

(4) Ability to target invasive angiography or surgery

When positive, CTA reveals the location and often the precise vascular anatomy leading up to the lesion.  This may facilitate the speed and success of a subsequent invasive angiography procedure to embolize the bleeding site.  If surgical resection is required, it may provide an adequate level of certainty that the surgeon will resect the appropriate segment of bowel.  Tagged RBC scans do not provide this level of precision.  


(5) Immediate prognostication and triage

CTA cannot detect very slow bleeding (i.e., < 0.3-0.5 ml/min).  Thus, although CTA may miss some cases of bleeding, it will miss the slowestsources of bleeding.  Indeed, although a negative scan doesn't reveal the source of bleeding, it still provides useful prognostic information. 

Lower GI bleeding has a mortality rate of 2-4%, significantly lower than upper GI hemorrhage.  Nonetheless, hematochezia may be quite visually impressive and this can provoke anxiety leading to over-transfusion and unnecessary ICU admission.  A negative CT angiogram may be a helpful clue that bleeding may have stopped spontaneously.  Chan 2014found that among patients presenting with lower GI bleeding and negative CTA, 77% had no recurrence of bleeding.  Thus, a patient with a negative CTA who is otherwise stable may be appropriate for admission to the ward rather than the ICU.


Drawbacks: Safety concerns

CTA does involve exposure to contrast dye, and if the patient requires invasive angiography this will involve two contrast exposures.  However, the existence of contrast nephropathy with modern contrast dyes is questionable (discussed further here).  CTA requires 100-125ml of IV contrast, which for comparison is less than half of what may be required for a complex cardiac catheterization procedure (Artigas 2013).  Overall, if the patient does not have severe renal failure and a safer contrast dye is utilized, this is unlikely to cause a problem.

CTA does also involve radiation exposure, which is concerning primarily among younger patients.  Younger patients overall are more likely to have an upper GI source of hemorrhage (most causes of lower GI bleeding such as diverticular bleeding and angiodysplasia become more common with age).  Therefore, it may be reasonable to try to utilize EGD rather than CTA as the initial test for younger patients, on the basis of both yield and avoidance of radiation exposure.

Invasive Angiography

Angiography is one of the most useful procedures for lower GI bleeding.  It has the capability to diagnose the source of bleeding, although this requires a faster bleeding rate compared to CTA (e.g., >0.5-1 ml/min) rendering it somewhat less sensitive.  Most importantly, it can provide therapeutic embolization. 

Angiography is usually not used as an initial test, except in cases of exsanguinating lower GI bleeding.  Without knowledge of where the bleeding is coming from (e.g. based on CT angiography or endoscopy), blind angiography is harder to perform as this requires sequential injection of multiple arteries searching for the bleed.  Angiography also requires mobilization of an interventional radiologist and the interventional radiology suite, which further limits its ability to be used as a first-line investigation.

Proposed approach


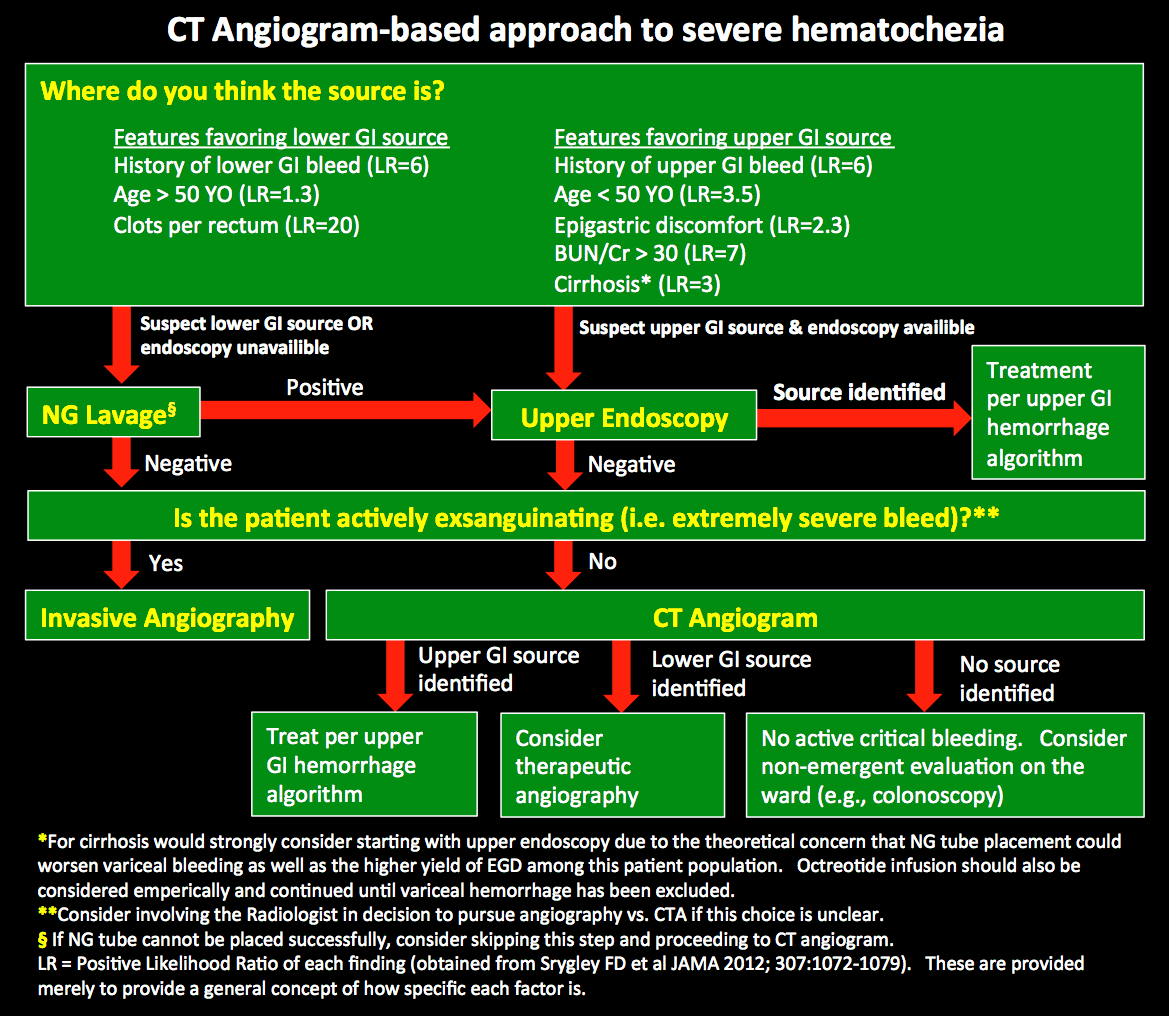
Above is flexible approach to severe hematochezia incorporating CT angiography and clinical judgment.  This is not truly "new," as various CTA-based approaches have been advocated for several years and are already utilized in many centers (e.g. Copland 2010).  However, knowledge translation has often been sluggish. 

The first goal of the algorithm is evaluating for upper GI hemorrhage, since these patients have the highest mortality and benefit most from intervention.  For patients at high likelihood of upper GI hemorrhage, it is sensible to proceed directly to EGD (as is currently recommended in many algorithms for all patients with hematochezia).  However, older patients without risk factors for upper GI bleed probably have a rate of upper GI bleed <10%.  If such a patient has a negative NG lavage, then their risk of having an upper GI bleed may be <5%.  At that pre-test probability, it may make more sense to proceed to CTA rather than EGD.  Mis-directing a patient with upper GI bleed to CTA should not cause the upper GI bleed to be missed for too long, since CTA is sensitive for upper GI bleeding as well as lower GI bleeding (1).

This algorithm eliminates both colonoscopy and tagged RBC scan from the initial approach to severe hematochezia (similar to the algorithm by Marion 2014).  Both of these tests are time-consuming and often low-yield.  Delaying other tests may allow intermittent bleeding sources to stop, reducing the diagnostic yield.  In contrast, CTA provides immediate information about the rate and location of bleeding anywhere in the GI tract. 

This algorithm does utilize NG lavage for some patients.  Some authors have recommended skipping NG lavage and proceeding directly to CT angiogram (Sun 2012).  However, NG lavage may occasionally be useful because if positive it will facilitate expedited management (allowing omission of CTA and proceeding directly to endoscopy).  A reasonable approach might be to try passing an NG tube with topical analgesia, but if this is not tolerated or unsuccessful not to persist with excessive attempts at NG passage.


  • Abdominal CT angiography is a fast test with high performance to reveal bleeding anywhere in the GI tract.  CTA has already replaced tagged RBC scanning in many centers.
  • An approach incorporating physician judgment, NG lavage, and CTA may allow for thorough evaluation of hematochezia without subjecting every patient to an upper endoscopy (EGD).
  • In situations where endoscopy is not immediately available, CTA may allow for rapid and accurate evaluation of hematochezia.  This may help identify which patients require immediate intervention and which patients can be safely observed.  


This post was co-authored with Dr. Paul Farkas, my father and senior consultant in Gastroenterology. 

Additional Reading
...
  • Copland A et al.  Integrating urgent multidetector CT scanning in the diagnostic algorithm of active lower GI bleeding.  Gastrointestinal Endoscopy, 2010; 72(2) 402-405.
  • Artigas JM et al.  Multidetector CT angiography for acute gastrointestinal bleeding: Technique and findings.  Radiographics 2013; 33: 1453-1470.

Notes

(1) Additionally, an upper GI bleed with a negative NG lavage presenting with hematochezia is likely to represent a penetrating duodenal ulcer (often involving the gastroduodenal artery).  It is not uncommon for this type of ulcer to fail to respond to therapy by EGD and require angiography.  Therefore, obtaining a CTA in this situation is not necessarily the "wrong" approach but instead it may prove useful in guiding angiography if EGD fails to achieve hemostasis.


Hypocaloric Nutrition: Theory, Evidence, Nuts, and Bolts

$
0
0

Introduction

Until recently there has been little evidence regarding the caloric target for feeding critically ill patients.  In the absence of evidence, it has been assumed that we should aim to meet 100% of predicted energy needs.  New multicenter RCTs challenge this dogma, particularly the PERMIT trial by Arabi et al.

Theory supporting hypocaloric nutrition

The nutrition paradox

Critically ill patients often don't have a good appetite, especially patients with sepsis.  Patients with severe illness on a hospital diet often consume well below the recommended number of calories.  This usually goes unnoticed.  However, once a patient is intubated, enteral nutrition is initiated and it rapidly becomes obvious whether or not the patient can tolerate full caloric intake.  If they cannot, it becomes a source of enormous consternation. 

This is paradoxical for two reasons.  First, if receiving 100% full caloric intake is essential, then this should be equally important before the patient is intubated.  However, we intuitively feel that force-feeding a septic patient with no appetite is a bad idea.  Second, there is considerable confusion regarding exactly how many calories critically ill patients burn (e.g., conflicting equations to predict caloric use), and what percentage of these calories we should replace.  Consequently, when we target 100% caloric repletion, it is unclear whether we are chasing the right target.

Nutrition may not prevent muscle breakdown


In the acute phase of critical illness, systemic inflammation induces a catabolic state with breakdown of the patient's muscle protein.  Ideally, administration of adequate nutrition would prevent this process entirely.  However, muscle breakdown is a complex process driven by inflammation as well as malnutrition and disuse, which does not respond completely to nutritional supplementation.  Beyond a certain point, aggressive nutritional support may promote fat gain instead of preventing muscle loss (Schetz 2013).

Autophagy may be a good thing in moderation.


Autophagy is a process wherein cells under stress digest and recycle organelles and proteins.  This process is stimulated by starvation, and suppressed by feeding or insulin.  Animal models suggest that autophagy could be beneficial in acute lung injury as well as septic shock (Mizumura 2012).  It is possible that provision of excessive nutrition and insulin could inadvertently suppress autophagy with harmful consequences. 

Landmark papers about hypocaloric nutrition

ARDS-NET investigators.  Initial trophic vs. full enteral feeding in patients with acute lung injury: the EDEN randomized trial.  JAMA 2012.

This is a prospective multicenter RCT of patients intubated for acute lung injury comparing full enteral feeding to lower-volume trophic feeding for six days (1).  After six days, all patients received full enteral nutrition.  Patients randomized to trophic feeds received 20 kCal/hour, equal to about 25% of the estimated daily caloric goal.  One thousand adults were recruited.


There was no difference in mortality, ventilator-free days, infection, or other organ failures.  Patients in the trophic feeding group experienced less regurgitation (0.4% vs. 0.7%; p=0.003), less vomiting (1.7% vs. 2.25; p=0.05), and on average two liters lower fluid balance.  As shown below, patient in the trophic feeding group achieved superior glycemic control despite receiving less insulin.  Note that after one week, insulin requirements decreased in the full feeding group, possibly reflecting a decrease in systemic inflammation and insulin resistance (more on this below).


Overall this study demonstrated that among patients with acute lung injury (mostly due to sepsis or pneumonia) a short period of underfeeding did not impact mortality or major organ function.  As might be expected, lower nutritional targets improved gastrointestinal tolerance and glycemic control.  This supports the practice of temporarily providing very low-level enteral nutrition if there are obstacles to providing a greater degree of nutritional support. 

Arabi YM et al.  Permissive underfeeding or standard enteral feeding in critically ill Adults (the PERMIT trial), NEJM 2015.

This is a prospective multicenter RCT comparing provision of 40-60% of estimated caloric requirements versus 70-100% of estimated requirements, with all patients receiving the same protein intake.  894 critically ill patients with medical, surgical, or trauma admission were included, of whom 97% were intubated.


The study was well executed, with clear separation between the two groups (panel A above).  The primary outcome was mortality at 90 days, which was 27.2% in the hypocaloric group vs. 28.9% in the full nutrition group (p=0.58).  Similar to the EDEN trial, patients in the hypocaloric nutrition group achieved better glycemic control despite requiring less insulin, and had a slightly lower fluid balance (panels C-E above).  There were no differences in ventilator-free days or overall severity of illness (panel F above).  

Hypocaloric nutrition caused a slight increase in endogenous protein loss at 7 days with no difference at 14 days (as measured by nitrogen balance; panel I above).  This supports the concept that above a certain threshold, additional caloric intake doesn't strongly affect breakdown of muscle proteins. 

Although the benefits of hypocaloric nutrition shown in this study are debatable, the study provides evidence that administration of 50% predicted caloric needs is safe for two weeks.  However, it must be noted that the investigators used a specifically designed formulation to target providing 100% of protein requirements using protein supplements.

Limitations of both EDEN and the PERMIT trial

Although these are both well-performed prospective RCTs, they do share some limitations in common.  Both studies excluded patients with pre-existing malnutrition, severe shock, or burns.  EDEN also excluded patients with neuromuscular disease, severe chronic respiratory failure, or obesity, with PERMIT excluding patients with pregnancy.  Thus, these findings may not apply to all patients, especially patients with pre-existing debilitation or unusually high metabolic demands.

Another limitation of these studies was that they were performed in research centers with extremely close attention to the number of calories the patient was receiving.  Even in this setting, patients received less than target caloric intake (e.g. in the PERMIT trial, the "100% nutrition" group only received 70% of the calorie goal).  In real-world settings, interruptions in tube feeding would likely be a greater problem, potentially leading to a risk of substantial under-feeding.  Therefore, if hypocaloric nutrition is performed, special attention is required to the number of calories the patient is actually receiving.

Nuts & bolts of providing hypocaloric enteral nutrition

Some early studies showed an increased risk of infection with hypocaloric nutrition.  However, upon closer examination this was linked to administration of lower amounts of protein, rather than lower numbers of calories (Tian 2015).  Therefore, when providing hypocaloric nutrition it appears important to provide 100% of the daily requirement of protein (Weijs 2013).  This cannot be achieved by simply cutting the rate of tube feeds in half. 

If a nutritionist is not immediately available, the following approach may be used with most patients (excluding, for example, patients with renal failure or morbid obesity).  This approach is not completely precise.  However, since our nutritional targets are rough estimates, the entire concept of precision may be moot.  In a busy ICU, complex equations are often a barrier to implementing an evidence-based nutritional strategy at the bedside.  The approach used here is designed to be a fast and easy way to obtain a reasonablenutritional prescription.

First, a type of tube feed should be selected.  This gets confusing because several dozen tube feed formulations exist from a variety of brands.  Below is a classification of common tube feeds.  For patients with high residuals or emesis, a more concentrated formulation may be useful.

Rough classification of tube feed formulations
  • 1 kCal/kg, low-protein (~0.04 grams/ml)
    • Osmolite 1-cal
    • Peptamen
    • Nutren 1.0
  • 1 kCal/kg, high-protein (~0.065 grams/ml)
    • Promote, Promote with fiber
    • Replete, Replete with fiber
    • Peptamen VHP
  • 1.5 kCal/kg concentrated (~0.065 grams/ml)
    • Isosource 1.5
    • Nutren 1.5
    • Peptamen 1.5
    • Osmolite 1.5
    • Jevity 1.5
    • Respalor 1.5
  • 2 kCal/kg concentrated (~0.08 grams/ml)
    • TwoCal HN
    • Nutren 2.0
    • NutriRenal 2.0
    • NovaSource Renal

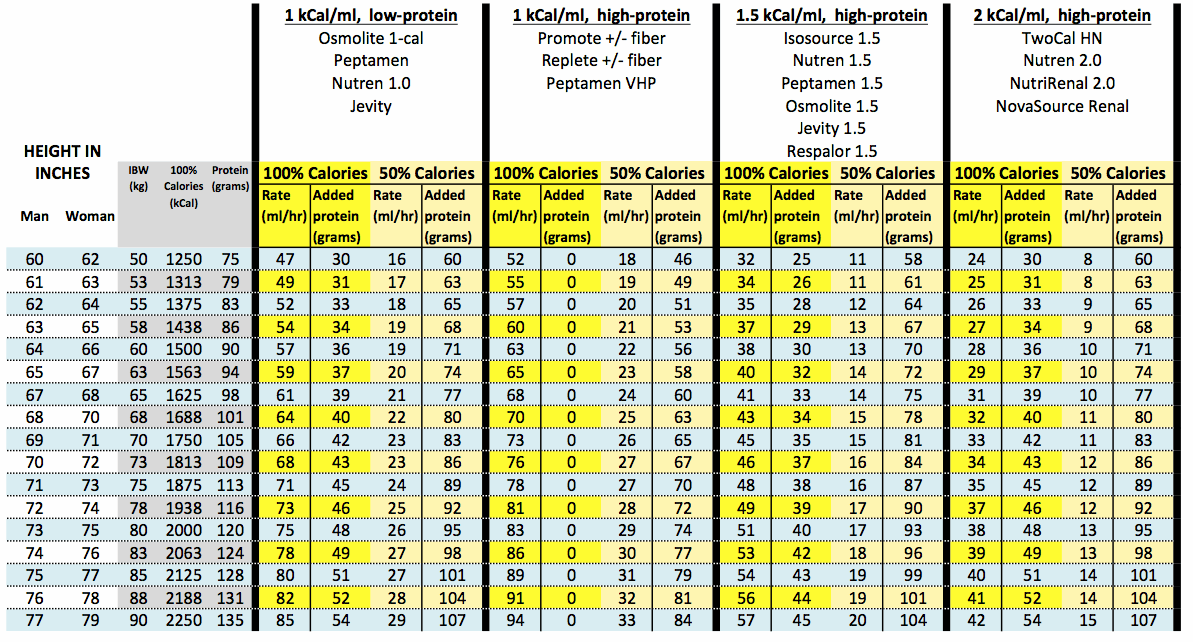
The table below provides nutritional prescriptions based on gender, height, and tube feed formulation.  The resulting prescription is a rateof the tube feed along with an additional amount of pure protein supplementation (available in different hospitals as either scoops of protein powder or packets of protein paste).  This table is based on approximating the caloric requirements as 25 kCal/kg/day and the protein requirement in critical illness as 1.5 grams/kg/day, both using the ideal body weight (2). 


This table looks busy, but it's easy to use.  For example, suppose that we wanted to provide hypocaloric nutrition to a man with height 68 inches using Nutren 1.5.  As shown below, this can be provided using a rate of 15 ml/hour plus 78 grams of supplemental protein per day.


Discussion

For decades it has been dogmatically accepted that nutritional support must provide 100% of the estimated caloric requirement at all times.  Although this may seem to be physiologic, it is not the body's natural response to inflammation.  Normally inflammation causes a reduction in appetite with negative caloric balance and weight loss.  Although this is not sustainable chronically, it is possible that having a negative caloric balance temporarily during acute illness could be beneficial (e.g. due to stimulation of autophagy and avoidance of aspiration).

The ideal caloric intake during acute illness remains unclear.  The EDEN trial shows that it is safe to provide 25% of the caloric goal for five days.  The PERMIT trial shows that targeting 50% of the caloric goal for two weeks was similarly safe.  Although neither trial showed improved mortality, there were some signals of benefit from hypocaloric nutrition (improved gastrointestinal tolerance, improved glycemic control, and more negative fluid balance).

It is possible to imagine that the ideal caloric administration could be dynamic over time (figure below).  Initially when the patient is severely ill, it might be unwise or difficult to provide 100% of the estimated caloric requirement.  Over time, as the patient recovers, the amount of nutrition could be increased.  Acute illness involves characteristic evolution in hemodynamic, endocrine, and fluid shifts so it makes sense that nutritional requirements would be dynamic as well.


This evidence may not be strong enough to indicate that hypocaloric nutrition should be used for most ICU patients.  However, hypocaloric nutrition may be a reasonable strategy when managing an acutely ill patient with difficulty tolerating tube feeds (e.g. due to emesis and distension).  It is possible that the patient may simply not be ready to tolerate 100% caloric nutrition, so attempts to force this intake (e.g. with prokinetic agents) may be ill-conceived.  Rather than continuing to chase a target 100% caloric provision, it may be safer and more successful to temporarily target 50% caloric provision with 100% protein administration.  This could reduce the likelihood of distension, vomiting, or complete failure of enteral nutrition (with transition to parenteral nutrition). 


  • Nutrition has a variety of effects on the endocrine and immune systems.  Clinical evidence is required to determine the ideal nutritional target during acute illness, rather than assuming that 100% nutritional provision is ideal all the time. 
  • The PERMIT trial provides evidence that hypocaloric nutrition is safe among most acutely ill ICU patients for limited periods of time (e.g. 50% calorie provision for two weeks with administration of 100% of protein requirements). 
  • Currently it is unclear whether hypocaloric or full nutrition is superior upon admission to the ICU.  The ideal nutritional strategy likely varies between patients based on several variables (e.g. pre-existing malnutrition, difficulty tolerating feeds). 
  • Hypocaloric nutrition may be a reasonable short-term approach for many patients who are having difficulty tolerating 100% caloric administration.
  • For most ICU patients (e.g. without morbid obesity or renal failure), the following table may be used to quickly estimate a prescription for enteral nutrition which provides 100% of estimated protein requirements despite varying levels of calories. 


Same figure on its side (may be easier to read with a smartphone):

Additional reading
  • Schetz M et al.  Does artificial nutrition improve outcome of critical illness?  Critical Care 2013.
  • Wischmeyer PE.  The evolution of nutrition in critical care: how much, how soon?  Critical Care 2013.

Notes

(1) The term "trophic" feeding refers to very low levels of enteric feeding intended to prevent atrophy of the gut border.  This may also be referred to as "trickle" feeding.

(2) Note that 1.5 grams/kg/day protein and 25 kCal/kg are consistent with both ASPEN and ESPEN Guidelines (American & European nutritional societies)(Weijs 2013).  There seems to be a bit more consensus about protein requirements, with the 1.5 g/kg/day figure consistent with recommendations and most articles on the topic.  There are a wider variety of equations and methods used for determining total energy requirement. 


Sleep-protective monitoring to reduce ICU delirium

$
0
0

Introduction

Recently an excellent post on the Trauma Professional's Blog pointed out that nocturnal vital signs disrupt sleep and may be unnecessary in stable patients (e.g. patients recovering from minor orthopedic surgery).  I couldn't agree more.  Allowing restorative sleep is one of the best approaches to prevention of delirium.

What about patients in the ICU?  Critically ill patients certainly require monitoring, but are also at increased risk of delirium.  How can we monitor patients safely without (literally) driving them crazy?

Sleep-protective vs. sleep-disruptive vital signs

In the ICU, we have the luxury of having patients attached to a variety of continuous monitors which can unobtrusively obtain information.  Provided that the alarms are set appropriately, this allows for nondisruptive patient monitoring.  For example, pulse oximetry and respiratory rate can easily be obtained in a sleeping patient, providing useful information about oxygenation and respiratory efforts.


The only two vital signs which often interfere with sleep are temperature and blood pressure monitoring.  Avoiding temperature measurement when the patient is asleep is probably fine for most ICU patients (with the exception of patients with neurologic injury, in whom fever may be more problematic).  What about blood pressure?

Nondisruptive hemodynamic monitoring

Blood pressure is certainly an important vital sign.  However, it's not the only approach to hemodynamic monitoring.  In particular, the presence of good urine output is reassuring evidence of adequate end-organ perfusion. 


Above is one possible approach to sleep-protective hemodynamic monitoring.  This may be considered in patients who are not at high risk for development of shock and don't have active cardiac problems (e.g., a patient admitted for COPD exacerbation).  If efforts are made to obtain blood pressure and temperature measurements when the patient is awakened for other reasons (e.g. phlebotomy, repositioning), then this would probably result in a fair amount of blood pressure and temperature monitoring as well.  

Patients in whom nocturnal stimulation is especially problematic

The risk of occult hemodynamic deterioration must be weighed against the risk of stimulating patients with vital sign monitoring.  For example, patients who have already developed delirium are at greater risk of persistent or worsening delirium due to sleep deprivation.  Patients with asthma or COPD exacerbation and a significant component of anxiety should be allowed uninterrupted sleep if at all possible, because arousal and anxiety may fuel their dyspnea in a vicious cycle (described previously here).

Greater focus on continuous monitoring may be useful


Current technologies allow for continuous monitoring of heart rate and respiratory rate using a single set of three EKG leads.  Close attention to trends in continuously acquired information may detect instability earlier than intermittent vital sign monitoring.  In particular, worsening tachypnea and tachycardia often precede overt clinical deterioration, so focusing on trends in these parameters may be especially useful (Cretikos 2008).


  • Providing adequate sleep and maintaining normal circadian cycles are important to prevent and manage delirium in the ICU.
  • The hemodynamic and respiratory status of ICU patients can often be assessed without interrupting sleep using respiratory rate, pulse oximetry, heart rate, urine output (if catheterized), and ventilator parameters (if intubated).
  • In patients at low risk of hemodynamic decompensation, blood pressure monitoring may be suspended during sleep if there are other signs available for hemodynamic monitoring (e.g. heart rate and urine output).   The ideal monitoring strategy may be determined on a patient-by-patient basis, weighing the risk of hemodynamic deterioration vs. the harm of sleep deprivation.   


Image Credits: Monitor image from http://www.mc.vanderbilt.edu/documents/7north/files/MP5%20Rev_%20G%20Training%20Guide.pdf

CT angiography for lower GI bleed: the University of Pennsylvania Experience

$
0
0
 
Introduction

A post two months ago explored the use of CT angiography instead of tagged RBC scans for the evaluation of lower GI bleeding (here).  The algorithm below was developed based on evidence regarding the speed and performance of various tests.  However, there was no direct evidence validating this algorithm.  A new study from the University of Pennsylvania provides some interesting evidence in this regard. 


Jacovides CL et al.  Arteriography for lower gastrointestinal hemorrhage: Role of preceding abdominal computed tomographic angiogram in diagnosis and localization.  JAMA Surgery May 2015.

This was an observational trial of the effect of implementing a protocol for lower GI hemorrhage involving prompt CT angiography for all urgent and emergent cases (below).  The protocol was implemented in 2009.  Data was extracted from all patients undergoing invasive angiography for four years before and after protocol implementation. 


161 invasive angiographic procedures were performed, 78 before and 83 after implementation of the protocol.  Following protocol implementation the use of CT angiography increased from 4% to 57% and the use of tagged RBC scanning decreased from 83% to 51%, revealing incomplete protocol adherence. 

There was little difference in average outcomes following protocol implementation.  There was no difference in the ability to detect the source of bleeding at invasive angiography, success of embolization, the average minimum hemoglobin level, or the number of patients requiring surgery. 

CT angiography was superior at localizing the hemorrhage compared to tagged RBC scan, using invasive angiography as the gold standard (figure below).  This may explain the lower fluoroscopy time when invasive angiography was preceded by CT angiography compared to tagged RBC scan (18 minutes vs. 28 minutes, p=0.002).  Compared to invasive angiography following tagged RBC scan, invasive angiography following CT angiography was associated with greater of identification of the bleeding source (46% vs. 26%, p=0.05) and embolization (40% vs. 23%, p=0.07). 


Compared to patients who underwent tagged RBC scan, CT angiography did result in the use of more intravenous contrast (220 ml vs. 130 ml, p<0.001).  However, this did not lead to any deterioration in renal function.  There was actually a trend towards improvedrenal function among patients receiving CT angiography (average peak creatinine was 200% of baseline following tagged RBC scan vs. 160% of baseline following CT angiography, p=0.09).  This is difficult to interpret.  It is possible that CT angiography led to faster hemostasis and better renal perfusion.  However, it is also possible that this correlation could be the result of confounding due to clinicians selecting tagged RBC scans in patients with elevated creatinine.  As previously discussed on this blog, it is unclear whether newer contrast dyes are truly nephrotoxic.

Strengths & weaknesses of the study

Most evidence on this topic is with regard to either CT angiography or tagged RBC scan alone.  The primary strength of this study is that it provides a pragmatic comparison of the two approaches at a single medical center.

One weakness of the study may be that it selected only patients taken for invasive angiography, rather than all patients admitted with lower GI hemorrhage.  This may provide a skewed perspective of this disease process.  For example, if a patient was admitted, had a negative CT angiogram, and subsequently exsanguinated and died prior to invasive angiography this event would not be captured in the current study. 

Another weakness is that this is a before-and-after observational study following implementation of a new protocol.  This study design is subject to confounding factors associated with implementation of a new protocol, such as increased awareness of the disease process and increased enthusiasm for its treatment.  It is also possible that technological improvements in invasive angiography during the study period (2005-2012) could have been a confounding factor. 

Finally, there appears to have been incomplete adherence with the protocol.  Even after adoption of the new protocol, 51% of patients received at least one tagged RBC scan and only 57% of patients had a CT angiogram.  Poor adherence may have reduced differences in average outcomes between the two time periods.  In attempts to overcome this problem, subset analysis was utilized to compare patients who received a tagged RBC scan versus CT angiography prior to invasive angiography.  Unfortunately, this retrospective subset analysis introduces additional confounding factors.

Conclusions

It would be difficult to perform a prospective RCT comparing CT angiography to tagged RBC scan for evaluation of lower GI bleeding.  Such a study has never been done, and is unlikely to ever be performed.  In the absence of a definitive RCT, we are forced to rely on less direct comparisons.  The University of Pennsylvania experience provides useful information about what a transition to early CT angiography might look like. 

There was no benefit to average patient outcomes following implementation of the protocol utilizing CT angiography.  This may relate to poor adherence to the new protocol.  Compared to tagged RBC scans, CT angiography had greater accuracy of identifying the bleeding source and led to a greater likelihood of finding the source of bleeding during invasive angiography.  Although CT angiography did increase the volume of intravenous contrast dye administered, there was no evidence that this caused renal injury.

This study was performed at a large medical center with the availability of nuclear medicine to perform a tagged RBC scan 24 hours a day, seven days a week.  Many hospitals with fewer resources lack this capability.  At a hospital with only intermittent ability to perform tagged RBC scans, a CT angiography strategy would offer greater advantages.

Overall this study supports a CT angiography-based strategy as a legitimate and evidence-based approach to lower GI bleeding.  With ongoing improvements in multi-detector helical CT scanners and safer intravenous contrast, we expect that the pendulum will continue to swing towards CT angiography as an immediate and definitive approach to evaluate a patient with critical lower GI hemorrhage. 


Coauthored with Paul Farkas MD, senior consultant in Gastroenterology and dad extraordinaire.  Happy Father's Day! 

Related posts:


Understanding lactate in sepsis & Using it to our advantage

$
0
0
Introduction with a case

Once upon a time a 60-year-old man was transferred from the oncology ward to the ICU for treatment of neutropenic septic shock.  Over the course of the morning he started rigoring and dropped his blood pressure from 140/70 to 70/40 within a few hours, refractory to four liters of crystalloid.

In the ICU his blood pressure didn't improve with vasopressin and norepinephrine titrated to 40 mcg/min.  His MAP remained in the high 40s, he was mottled up to the knees, and he wasn't making any urine.  Echocardiography suggested a moderately reduced left ventricle ejection fraction, not terrible but perhaps inadequate for his current condition. 

Dobutamine has usually been our choice of inotrope in septic shock.  However, this patient was so unstable that we chose epinephrine instead.  On an epinephrine infusion titrated to 10 mcg/min his blood pressure improved immediately, his mottling disappeared, and he started having excellent urine output. 

However, his lactate level began to rise.  He was improving clinically, so we suspected that the lactate was due to the epinephrine infusion.  We continued the epinephrine, he continued to improve, and his lactate continued to rise.  His lactate level increased as high as 15 mM, at which point the epinephrine infusion was being titrated off anyway.  Once the epinephrine was stopped his lactate rapidly normalized.  He continued to improve briskly.  By the next morning he was off vasopressors and ready for transfer back to the ward.

This was eye-opening.  It seemed that the epinephrine infusion was the pivotal intervention which helped him stabilize.  However, while clinically improving him, the epinephrine infusion was also driving his lactate to very high levels.  How could this be?  Isn't lactate evil?  Isn't the entire point of sepsis resuscitation to normalize the lactate? 

Basic science: Understanding lactate in sepsis

The classical understanding of lactate in sepsis is flawed.  The following is a brief overview of newer ideas about lactate.  For a more complete discussion please see articles by Paul Marik listed below in the references. 

(1) Elevated lactate in septic shock is not due to anaerobic metabolism

Traditionally it was believed that elevated lactate is due to anaerobic metabolism, as a consequence of inadequate perfusion with low oxygen delivery to the tissues.  This has largely been debunked.  Most patients with sepsis and elevated lactate have hyperdynamic circulation with very adequate delivery of oxygen to the tissues.  Studies have generally failed to find a relationship between lactate levels and systemic oxygen delivery or mixed venous oxygen saturation.  There is little evidence of frank tissue hypoxemia in sepsis.  Moreover, the lungs have been shown to produce lactate during sepsis, which couldn't possibly be due to hypoxemia (Marik 2014). 

This has significant implications for sepsis treatment.  Traditional belief in inadequate oxygen delivery led to multiple interventions to improve oxygen delivery (e.g. blood transfusion to target a hemoglobin of 10 mg/dL, use of inotropes to increased mixed venous oxygen saturation >70%, and nitroglycerine infusion for hypertensive patients).  Lack of oxygen deficiency may explain why these interventions have not proven to be beneficial.

(2) Elevated lactate in septic shock is mostly due to stimulation of beta-2 adrenergic receptors

Lactate elevation in sepsis seems to be due to endogenous epinephrine stimulating beta-2 receptors (figure below).  Particularly in skeletal muscle cells, this stimulation up-regulates glycolysis, generating more pyruvate than can be used by the cell's mitochondria via the TCA cycle.  Excess pyruvate is converted into lactate. 

This process is entirely aerobic, occurring despite adequate oxygen delivery.  Lactate generation doesn't occur because the mitochondria are unable to function in the absence of oxygen.  Instead, lactate generation occurs because the TCA cycle simply isn't able to keep up with a very rapid rate of glycolysis. 


(3) Elevated lactate in shock might be a beneficial compensatory response

Lactate serves as a metabolic fuel for the heart and brain in conditions of stress.  In a rat sepsis model, depletion of lactate caused cardiovascular collapse, which could be reversed by infusing sodium lactate (Levy 2007).  This study also found that selective blockade of beta-2 receptors decreased lactate levels and reduced survival duration.  In humans, RCTs have shown that concentrated sodium lactate improves cardiac output among post-CABG patients and heart failure patients (Nalos 2014, Leverve 2008)(1). 

Lactate correlates with illness severity, generally being a sign of badness.  This may lead to the misconception that lactate itself is harmful.  However, like sinus tachycardia, although elevated lactate is an ominous sign it still may function as a beneficial compensatory mechanism. 

Clinical applications: Using lactate to our advantage

This alternative understanding of lactate has some implications for bedside patient management. 

(1) Identification of occult shock: Lactate still works.

The autonomic nervous system and endogenous catecholamines are mysterious and confounding.  When exposed to the same infection, some patients have a weak endogenous catecholamine response and immediately develop hypotension.  Other patients have a robust release of endogenous catecholamines which supports their blood pressure, preventing hypotension (these are often younger patients who may look deceptively well). 

Lactate is a marker of endogenous catecholamine release (2).  This makes lactate useful for detecting patients who have occult shock:  patients who are maintaining their blood pressure due to a vigorous endogenous catecholamine response.  These patients may have deceptively reassuring vital signs, masking the fact that they are in a catecholamine-dependent shock state (simply using their own catecholamines rather than, for example, a norepinephrine infusion).  Elevated lactate identifies these patients as having an increased risk of death or decompensation, thus requiring more aggressive management.  Although most often associated with sepsis, occult shock with elevated lactate may be seen with any cause of shock. 

(2)  Serial lactate levels to monitor a patient in septic shock? Unknown utility.

In 2010 Jones et al. demonstrated that trending serial lactate levels was non-inferior to using mixed venous oxygen saturation as a guide to sepsis resuscitation.  However, more recently the PROCESS, ARISE, and PROMISE trials have demonstrated that trending mixed venous oxygen saturation is unnecessary to begin with.  In hindsight, both interventions may be equally unnecessary. 


Currently it is unknown whether adding lactate to other resuscitation endpoints is beneficial.  For example, suppose a patient is doing well clinically (e.g. with an adequate blood pressure, good urine output, and down-titrating vasopressors) but has a persistently elevated lactate level.  Will escalating the resuscitation based on the lactate level be beneficial, or harmful due to over-resuscitation (e.g. volume overload, arrhythmic complications from vasopressors)? 

There is no clear evidence about how lactate might guide treatment intensity within the context of a modern sepsis resuscitation.  Many approaches are reasonable.  However, lactate is not an indicator of inadequate oxygen delivery, so an elevated lactate should not be blindly used as a trigger to increase oxygen delivery. 

(3) Lactated Ringer's (LR):  Still a physiologically sensible choice.


The common fear of administering lactate reveals a misunderstanding of LR and the role of lactate in shock states.  First, LR contains sodium lactate (not lactic acid), and is therefore not acidotic.  Second, lactate probably has a beneficial role as discussed above (although it is very rapidly metabolized).  Occasional concern has been raised about the effect of LR on trending lactate levels, but this effect is minimal and the utility of precisely trending lactate levels is unclear. 

Unfortunately, Plasmalyte and Normosol were designed decades ago specifically to avoid the administration of lactate.  Their design was misguided, as discussed in further detail here.  For most critically ill patients, LR may be the best crystalloid. 

(4) Epinephrine in septic shock: Underutilized due to fear of lactate?

Epinephrine has been recommended as a second-line vasopressor by many authors including the Surviving Sepsis guideline.  Although popular abroad, it is rarely used in the US.  One common reason for avoiding epinephrine is concern that it may cause elevated lactate levels which could be harmful or confound serial trending of lactate.

Improved understanding of lactate may allow us to utilize epinephrine more often.  As discussed above, serial trending of lactate is of unknown value and should not dissuade us from using epinephrine if this is the best drug.  Elevated lactate levels might be beneficial and provide a dual action of epinephrine on the heart, rather than representing an undesirable "side-effect:"


In 2010 Wutrichexamined the prognostic value of changes in lactate following initiation of epinephrine infusion in patients with shock (mostly septic shock).  Survivors had significantly greater increases in lactate over the first four hours of epinephrine therapy compared to nonsurvivors (figure below). Thus, an epinephrine-induced rise in lactate may be a good prognostic sign, indicating that the epinephrine is working.


Epinephrine's properties may make it ideal for patients who fail to respond well to norepinephrine (+/- low-dose vasopressin).  Such patients often have adequate afterload, but need some additional inotropy.  At low doses (e.g. 0-10 micrograms/min), epinephrine functions as an inotrope (Moran 1993).  For patients who fail to respond to inotropic doses of epinephrine, higher doses of epinephrine will provide inotropy and vasoconstriction as well.  Thus, an epinephrine titration may be a simple approach to rapidly trial inotropic support and then provide additional vasoconstriction if needed. 

There is only one RCT comparing epinephrine vs. dobutamine as a second-line agent for patients with septic shock on norepinephrine (Mahmoud 2012).  These authors found that compared to dobutamine, epinephrine led to faster hemodynamic stabilization, greater urine output, higher lactate levels, and no mortality difference.  Unfortunately this study is very limited by the use of low doses of norepinephrine (0.1 mcg/Kg/min). 

One advantage of the norepinephrine-epinephrine combination is that it is difficult to screw up.  Epinephrine alone is generally adequate for septic shock (Myburgh 2008).  Therefore, any combination of norepinephrine and epinephrine is probably fine.  Alternatively, when patients end up on norepinephrine combined with dobutamine, it is easier to make significant titration errors (e.g. titrating off norepinephrine before dobutamine). 


  • Lactate production in septic shock is not due to anaerobic metabolism or low oxygen delivery.  It is largely driven by endogenous epinephrine stimulating aerobic glycolysis via beta-2 adrenergic receptors. 
  • Lactate may have a protective effect, serving as a metabolic fuel for the heart and brain under conditions of stress. 
  • Elevated lactate is useful to identify occult shock (patients who are being maintained by a robust endogenous catecholamine release).  These patients are at increased risk for deterioration and require more aggressive care.
  • There is no clear evidence about what lactate adds to other resuscitation targets (e.g. blood pressure and urine output).  If lactate is trended during sepsis resuscitation, it should be interpreted carefully in clinical context.
  • Administration of sodium lactate is safe and potentially beneficial.  This supports the use of lactated ringers as a resuscitative fluid.
  • Epinephrine has often been avoided in the past due to concerns regarding lactate generation.  Given that lactate is potentially beneficial, epinephrine should be re-considered as a second-line vasopressor.  At low doses it works primarily as an inotrope, whereas at higher doses it also functions as a vasoconstrictor. 

Stay tuned for another post about septic shock next week.   

Notes

(1) In fairness it is also possible that some of these hemodynamic effects may be due to the alkalinizing effect of hypertonic sodium lactate.
(2) Of course, lactate may also be elevated by a variety of other conditions including mesenteric ischemia, medications such as metformin and propofol, various intoxications, liver failure, etc.  Any patient with elevated lactate requires careful consideration for these numerous causes.  When no obvious cause can be found, elevated lactate is generally regarded as a sign of shock until proven otherwise.

Additional information: 

Material from Paul Marik et al.
  • Garcia-Alvarez M, Marik PE, Bellomo R.  Sepsis-associated hyperlactatemia.  Critical Care 2014; 18: 503. 
  • Marik PE and Bellomo R.  Lactate clearance as a target of therapy in sepsis: a flawed paradigm.  Open Access Critical Care 2013.
  • [Lecture at SMACC Chicago - Will link to this when it becomes available] 

Related posts from EMCrit

Related posts from this blog

Steroids in septic shock: Four misconceptions and one truth

$
0
0
Introduction

The utility of steroids in sepsis has been debated passionately for decades.  There is hope that steroids might improve mortality, but also fear that they could increase infectious complications.  Practice varies widely.  What does the data truly indicate?

Four misconceptions and one truth

Misconception #1: Stress-dose steroids decrease mortality

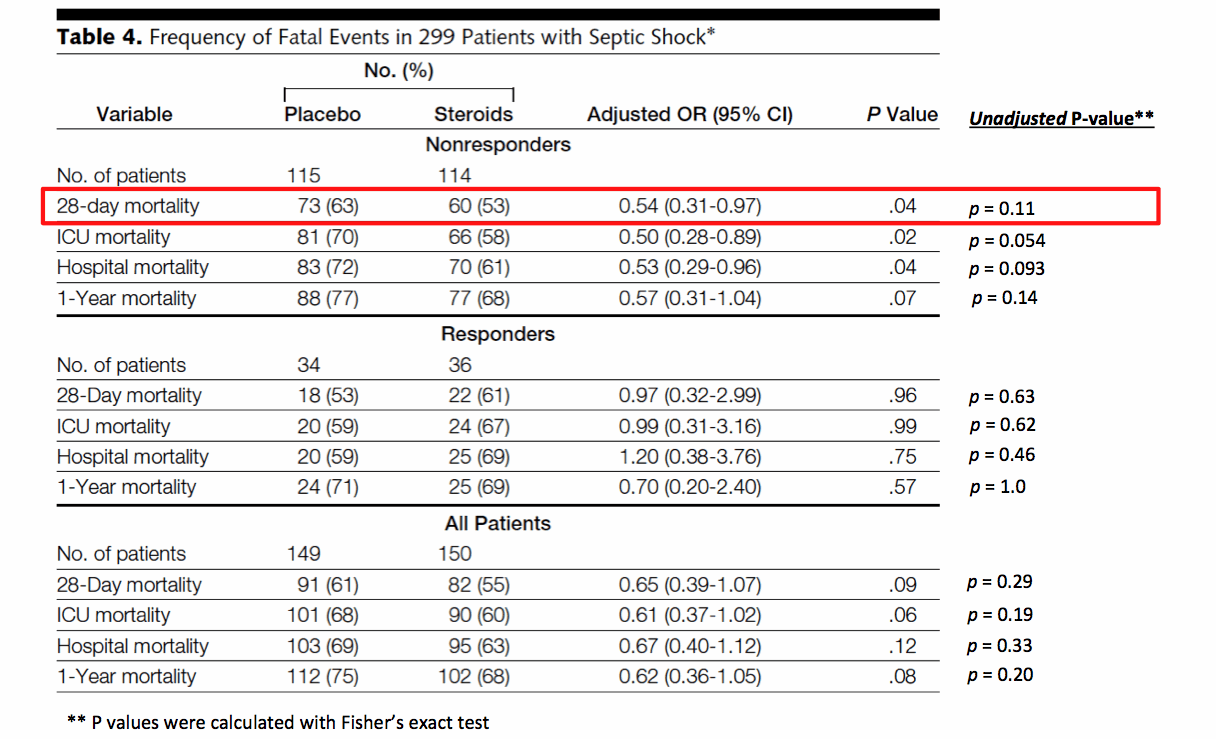
This belief is based on the first modern RCT of stress-dose steroids in sepsis by Annane et al. 2002.  This study randomized 299 patients with severe vasopressor-refractory shock to placebo versus stress-dose steroids.  Patients were also divided into two subgroups depending on whether they responded to an ACTH stimulation test.  Their hypothesis was that patients who failed to respond normally to the ACTH stimulation test had inadequate adrenal function and would improve with stress dose steroids.  The primary outcome was 28-day mortality (additional details in TheBottomLine blog here). 

Analysis of the raw data reveals no mortality benefit for steroid among any of the patient subgroups (see the unadjusted p-values, which I have added to the table below on the right column).  Most notably, 28-day mortality was not significantly reduced among patients who didn’t respond to the ACTH stimulation test (p=0.11, highlighted red box). 


Here is where things get murky.  The authors went on to perform an adjusted mortality analysis using a regression model derived from a prior study.  The adjusted analysis yielded lower p-values, with a value of p=0.04 for the primary outcome (red box above).  The remainder of the paper, and nearly all of the subsequent medical literature, has focused exclusively on the p-values from the adjusted analysis. 

This may not be valid.  There is generally no need to perform an adjusted analysis of an RCT.  The entire concept of a RCT is that randomization will naturally account for random variation, making an adjusted analysis unnecessary.  An adjusted analysis may rarely be performed if there is a considerable imbalance between the groups at baseline, but in this study the groups appear fairly well matched at baseline.  There is no explanation in the manuscript as to why an adjusted analysis was performed. 

Currently the ACTH stimulation test in sepsis has been abandoned, partially because it is erratic.  Therefore, the non-responder subgroup analysis is no longer clinically relevant to us.  The data which are most relevant today are the results from all patients combined.  These results are negative regardless of which statistical analysis is used.  Therefore, from our perspective today there is unequivocally no mortality benefit.

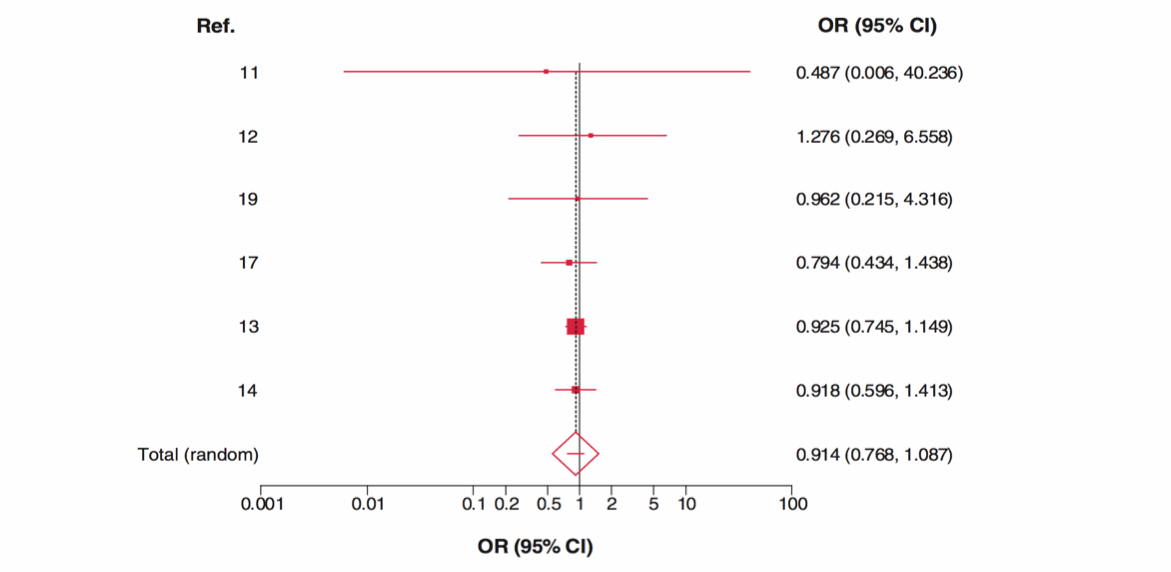
As shown below, a meta-analysis failed to find any mortality benefit in anysubset from any study (1).  Note that this meta-analysis used the uncorrected data from the Annane 2002 study.


Thus, no study has convincingly shown a mortality benefit in any group of patients.  It is possible that a mortality benefit exists which is too small to detect in these studies.  It is possible that a yet-unidentified subgroup of patients experiences a mortality improvement.  However, no mortality benefit has ever been clearly proven.

Misconception #2: Stress-dose steroids increase the risk of secondary superinfection

Concerns regarding superinfection with stress-dose steroid are largely based on the CORTICUS trial, the second major RCT of steroids in sepsis.  This study randomized 499 patients with septic shock to receive stress dose steroids or placebo.  The primary endpoint was 28-day mortality, with no difference observed between groups (for additional details see TheBottomLine here).  The authors also evaluated the occurrence of 25 adverse events, most notably:


This data was reported in the paper as follows:


This description is misleading.  As shown in the table above, there were no statistically significant differences in the rate of superinfection, new sepsis, or new septic shock.  In order to overcome this lack of statistical significance, the authors seem to have created a post-hoc combined adverse outcome of “new episodes of sepsis or septic shock.”  The validity of creating this combined outcome is questionable, and the statistical analysis of this combination outcome remains unimpressive (2). 

As shown below, meta-analysis by Sligl 2009 failed to detect any change in the rate of superinfection among any study or the pooled results. 


Thus, no study or meta-analysis has shown an increase in superinfections.  This possibility certainly hasn't been excluded.  However, if this risk exists, it doesn't seem to be of substantial clinical significance.

Truth: Stress-dose steroid reduces the duration of septic shock

Steroids consistently improve hemodynamic stability, thereby allowing earlier withdrawal of vasopressors and decreasing the duration of shock.  As shown in the meta-analysis below by Sligl 2009, this is reproducible across multiple studies and patient populations.

 
For example, the duration of septic shock among patients in the CORTICUS trial is shown below.  Among all patients, steroids decreased the median time to shock reversal from 5.8 days to 3.3 days (p<0.001). 


Misconception #3: The Annane et al. and CORTICUS studies conflict each other

It is widely believed that the Annane et al. and CORTICUS trials conflict with each other.  Annane et al. is perceived as supporting the use of steroids, whereas CORTICUS does not. 

However, the actual datafrom these two studies are entirely consistent.  The raw data from both studies shows no mortality benefit with steroids, faster shock resolution, and no increase in superinfection.  The Forrest plots above illustrate that in every single case the point estimates from both studies overlap, indicating statistical agreement.  If these two studies had been statistically analyzed and written in a less imaginative way, they would look and sound nearly identical. 

 
Rather than the data itself, it is primarily the data interpretation and press surrounding these studies which is conflicting.  Annane et al. performed an adjusted analysis which seemed to show a mortality benefit, causing enormous excitement about steroids.  CORTICUS reported no mortality benefit and focused on some trends among the adverse events, splashing cold water on the enthusiasm generated by Annane et al.

Misconception #4: The benefit of steroids is limited to patients with vasopressor-refractory shock

This misconception is a direct consequence of the misconception that Annane et al. was a positive study whereas CORTICUS wasn't (misconception #3).  It is commonly believed that the reason for this "difference" is that patients in Annane et al. were sicker at enrollment (Annane et al. required patients to have vasopressor-refractory shock, whereas CORTICUS did not).  This has led to the common belief that steroids should be reserved for patients with vasopressor-refractory shock.

In fact, Annane et al. and CORTICUS revealed similar clinical benefits from steroids (faster shock reversal).  Within CORTICUS, steroids caused an improvement in hemodynamic stability and possibly renal function (more on this below).  Thus, benefits of steroids do not seem so be restricted to patients with vasopressor-refractory shock.  


Patients with more severe sepsis might benefit more from steroids than patients with milder sepsis.  As shown above the side-effects from steroids are probably roughly stable, whereas the benefit may be greater for patients with more severe disease.  However, the point at which benefits might outweigh risks is unknown.

Conclusions

The use of steroids in sepsis may be similar to their use in COPD


Thus, steroids in sepsis are neither as awesome nor as scary as is often believed.  Steroids won't improve mortality, but neither will they lead to terrible superinfections.  The primary benefit of steroids may simply be to reduce the duration of shock.  This shouldn't be a huge surprise because stress dose steroids (200 mg/day hydrocortisone) are equivalent of 50 mg prednisone daily, a commonly used dose which is fairly safe in short courses.        

This may be similar to the role of steroids in patients with COPD exacerbation.  Steroids don’t improve mortality in COPD.  Compared to placebo, steroids reduced the average length of hospitalization by merely 1.2 days (Niewoehner 1999).  Nonetheless, steroids are an accepted treatment for COPD exacerbation.

The debate about steroids in sepsis has been focused on whether steroids effect mortality.  This might be the wrong question.  A more relevant and practical question may be whether it is worth using steroids in order to reduce the duration and severity of septic shock.


Reducing shock duration could have meaningful consequences.  Prompt resolution of shock could improve organ perfusion and function.  For example, a post-hoc analysis of CORTICUS showed that patients with renal failure who received steroids had a significantly higher likelihood of renal recovery (figure above; Moreno 2011).  As discussed previously here, renal recovery in septic shock appears to be critical for achieving good outcomes. 

For now, how should we use steroids?

The precise risk/benefit balance remains unclear.  Steroids are proven to improve hemodynamics and speed shock resolution, which might facilitate recovery among the most unstable patients.  However, steroids do have a number of potential side-effects including myopathy, hyperglycemia, and peptic ulcer disease.


The above approach may be reasonable.  Some patients have indications or contraindications for steroids, but mostly it may be a matter of clinical judgment.  Individual patient characteristics may tip the risk/benefit balance one way or the other.  In the absence of definitive evidence, judgment is needed. 

Unfortunately, clinical judgment is nebulous and leads to variation between practitioners.  However, this is the nature of critical care medicine.  The most that we can ask of ourselves and our colleagues is to carefully consider the situation and make our best call.


  • Misconception #1 = Stress-dose steroids can improve mortality.   (Evidence: There is no convincing data that stress-dose steroids improve mortality.)
  • Misconception #2 = Stress-dose steroids increase risk of superinfection.   (Evidence: There is no statistically significant increase in the rate of superinfection.) 
  • Misconception #3 = Annane et al. and CORTICUS, the two major trials investigating stress dose steroids in septic shock, obtained conflicting results.  (Evidence: The raw data from these studies is consistent.)
  • Misconception #4 = The benefit of stress dose steroid is restricted to patients with vasopressor-refractory septic shock.  (Evidence: There is no clear demarcation of which patients may or may not benefit from steroids.)
  • Truth = Stress-dose steroids consistently reduce the duration of septic shock. 
  • Overall this may be similar to the utility of steroids in COPD exacerbations: a treatment which hastens recovery and improves organ function without affecting mortality. 
  • Which patients may benefit from stress dose steroid remains unclear.  For now, careful consideration of each patient with clinical judgment may be a reasonable approach.

Stay tuned for the culmination of this three-week series on septic shock next week. 

Notes

(1) To add to the confusion, there are numerous meta-analyses of these studies which come to opposing conclusions.  Some meta-analyses were more inclusive, including smaller studies and studies of patients with more variable characteristics.  Most recently there have been three meta-analyses which focused on higher-quality studies with less bias: Sligl 2009, Wang 2014, and the Position statement of the American Academy of Emergency Medicine (Sherwin 2012).  These three studies are generally in agreement and appear to represent the highest quality meta-analytic data at this point.

(2) A total of 26 statistical tests were performed on various adverse outcomes.  Given this many tests, the odds of one or more test being “positive” at the p<0.05 level is 74%!  To reduce the likelihood of obtaining a false-positive test among several tests, the p-value of each individual test must be reduced based on the number of tests (e.g. using a Bonferroni correction, which in this case would suggest that any individual test would require a p-value of <0.05/26 or <0.002 to be deemed "significant").  Thus, the statistical results for the combined adverse outcome of "new sepsis or new septic shock" is still not statistically significance.

Related posts on septic shock


Accelerated Goal Directed Therapy for Septic Shock

$
0
0


Introduction

The Surviving Sepsis Campaign has raised awareness that septic shock is a medical emergency.  However, these guidelines recommend a stepwise approach to resuscitation, which commonly results in a gradual escalation of treatment intensity.   Additional therapies are added over several hours if the patient fails to reach treatment goals.  For some patients, this approach may not be rapid enough to get ahead of the disease process.  

Accelerated goal directed therapy is a streamlined approach designed to escalate resuscitation more rapidly and achieve stabilization more quickly.  This is primarily designed with the sickest patients in mind.  However, when in doubt, it may be safer to err on the side of aggressive stabilization followed by prompt de-escalation once the patient is recovering. 

Usual approach to septic shock


A typical approach to septic shock is shown above.   Initial therapy typically consists of antibiotics and 4-6 liters of fluid resuscitation, often over several hours.  If this fails, a series of vasopressors are added sequentially.   Finally, steroid is initiated for patients with vasopressor-refractory shock.   The time between initiation of treatment and maximally aggressive therapy is often 6-12 hours.  The IMPRESS trial, a multinational survey of sepsis care released this month, revealed only 66% compliance with the use of vasopressors for hypotension within six hours among the sickest cohort of patients.  

The sequencing of this approach is suboptimal for the sickest patients.  It used to be believed that vasopressors only increased afterload and contractility.   In that case, it would make sense to provide fluid first to "fill the tank," before starting vasopressors.   However, we now understand that norepinephrine causes venoconstriction as well as arterial constriction, thereby increasing the preload and "filling the tank" by itself.  By increasing preload, afterload, and contractility simultaneously, norepinephrine stabilizes circulation immediately and reverses the physiologic derangements of early sepsis (which is a vasodilatory shock state).  In contrast, severe septic shock responds poorly to fluid, so a fluid-first approach often delays stabilization.

Early initiation of bactericidal antibiotics is universally recommended.   As discussed previously here, evidence supporting this is correlational.  In some cases bactericidal antibiotics release inflammatory bacterial products into circulation  (e.g. lipopolysaccharide from gram negative rods).  Releasing this inflammatory material without providing other therapies to stabilize the patient may cause deterioration.

Thus, a strategy of starting with antibiotics and fluid alone may cause temporary improvement while setting the stage for subsequent hemodynamic collapse.  Inflammation combined with intravascular volume overload may damage the endothelial glycocalyx, causing capillary leak.  Although providing fluid may temporarily improve hemodynamics, this fluid may be rapidly lost from leaky capillaries with rebound deterioration.  This may explain the results of the FEAST trial, a study of septic children in Africa wherein administering fluid boluses seemed to cause initial improvement but actually led to delayed hemodynamic death (Maitland 2011).

Is Early Goal Directed Therapy really "early" enough? 

Our current management of sepsis is based on the concept of Early Goal-Directed Therapy (EGDT), wherein therapies are escalated depending on the patient response.  Ideally this would work as shown below, with therapies carefully titrated to match the intensity of the disease.  


However, some very sick patients may deteriorate while resuscitation is being escalated (figure below).  This may result in a delay or inability to stabilize the patient.   By the time resuscitation has escalated, the disease has already spiraled out of control: 


With accelerated goal directed therapy, escalation is not a finely titrated process.  Instead it is accepted that the initial resuscitative efforts will exceed the minimum level required to stabilize the patient.  Subsequently, as the patient improves, the intensity of resuscitation is carefully reduced.  


Goals for the first hours of resuscitation

The surviving sepsis guidelines include a number of complex resuscitation goals which may delay stabilization.   For example, mixed venous oxygen saturation requires placement of a central line, obtaining a blood sample, and sending it to the lab.   Lactate levels requires two sequential blood samples to be drawn and sent to the lab to reveal the change of the lactate level.  Any resuscitation strategy built around these goals will inevitably be delayed. 

Goals for accelerated resuscitation must be easily and rapidly measurable at the bedside.  A reasonable set of goals may be: 

(#1) MAP goal:  Achieving a mean arterial pressure (MAP) capable of perfusing the vital organs is essential.  Usually a target of 65mm is selected initially.  As discussed further below, this goal should ideally be achieved almost immediately (e.g. within 10-15 minutes) using peripheral vasopressors.  An arterial catheter is desirable for most patients, but achieving the MAP goal should not be delayed while awaiting an invasive blood pressure measurement. 

(#2) Perfusion goal:  Urine output may be the most clinically relevant measurement of organ perfusion.  Unfortunately in some cases urine output cannot be evaluated (for example, in patients with acute tubular necrosis or chronic renal failure).  In such cases, extremity perfusion (e.g. mottling, temperature, capillary refill) might provide a rough estimate of perfusion.

Anatomy of accelerated goal directed therapy


One example of how accelerated goal directed therapy might be applied is shown above, with the components discussed below as follows:

(a) Conservative fluid strategy with immediate initiation of norepinephrine

The concept of starting norepinephrine immediately to stabilize hemodynamics and defend organ perfusion was discussed in detail previously here.   In short, for a patient with severe shock and hypotension, there is nothing to be gained by delaying a norepinephrine infusion.  The safety of initiating a peripheral norepinephrine infusion is increasingly supported in the literature (e.g., Cardenas-Garcia 2015). 

Fluid resuscitation may be started simultaneously with norepinephrine.  However, fluid overload correlates with mortality, renal failure, and may perpetuate a state of chronic septic shock as discussed previously here.  Thus, the ideal strategy may combine norepinephrine with a moderate amount of fluid, for example 2-3 liters.   Norepinephrine may increase the preload due to venoconstriction, maintaining an adequate preload while avoiding volume overload. 

(b) Initiation of low-dose vasopressin shortly after starting norepinephrine

Vasopressin is often conceived as a treatment for catecholamine-refractory shock.   However, this use has not been borne out by the evidence.  Retrospective subgroup analysis of the VASST trial suggested instead that vasopressin might be more effective when used in patients with mild shock (patients on 5-15 mcg/min norepinephrine).  Other RCTs of vasopressin have similarly found improved renal outcomes when vasopressin is initiated early in the course of sepsis (studies are reviewed here).  Therefore, if there is a role for vasopressin in sepsis, it should probably be started early.

Thus, my approach is usually to add a fixed, low-dose vasopressin infusion of 0.03 units/minute when the norepinephrine is running at a low rate (i.e. ~10 mcg/min).  The goal of the vasopressin isn't necessarily to increase the blood pressure but rather to improve renal function. 

There are many reasonable approaches to the use of vasopressin, and indeed it would be reasonable not to use it at all.  One approach which is probably unhelpful is to wait until the patient is refractory to high-dose norepinephrine and then see if adding vasopressin will stabilize the patient.  Adding low-dose vasopressin to high-dose norepinephrine probably won't make a big impact.  Instead, ordering a vasopressin infusion and waiting to see if it will work may delay initiation of a more effective agent (i.e. epinephrine).  So, if you're going to use vasopressin, it may be best to start it early in the resuscitation, without delaying other therapies. 

(c) Streamlined approach to vasopressors with epinephrine as a second-line inopressor

Patients refractory to norepinephrine and vasopressin often have adequate afterload but may benefit from increased inotropy.   Epinephrine functions as an inotrope at low doses (0-10 mcg/min), with additional vasoconstrictive activity at higher doses.  Epinephrine titration therefore is a simple way to first provide inotropy, and then provide additional vasoconstriction if necessary.   This may achieve hemodynamic stabilization faster than, for example, performing a complex titration involving norepinephrine, vasopressin, dobutamine, and phenylephrine.   The benefits of using epinephrine as a second-line inopressor were explored further in a prior post here(1). 

(d) Consider stress dose steroids earlier for the sickest patients

The use of steroids in septic shock was explored in detail last week.  In short, steroids are neither as beneficial nor as dangerous as often thought:  they do not decrease mortality, but neither do they increase the risk of superinfection.  Steroids have been consistently shown to improve hemodynamic stability and reduce the duration of shock.   It remains unknown which patients might benefit from steroids, perhaps patients who are the sickest and lack contraindications.    

Usual practices regarding the timing of steroid initiation are paradoxical.  A common misperception is that the benefit of steroids is restricted to patients with vasopressor-refractory shock.   This leads to the practice of waiting until the patient is refractory to vasopressors and on the verge of death before starting steroids.   However, it seems likely that steroids would be more effective if started earlierin the disease process. 

The ideal timing and patient selection for steroids is unknown.  However, in a patient with severe shock who is responding poorly to initial therapies it seems reasonable to start steroids sooner rather than later.


  • Usual approaches to sepsis include escalating resuscitation over a period of 6-12 hours, which may fail to stabilize the sickest patients.  In particular, a strategy of starting with fluids and antibiotics alone for the first few hours is often ineffective. 
  • Accelerated goal directed therapy is designed to escalate rapidly and achieve resuscitation goals within the initial golden hours of therapy.
  • One major goal is to establish an adequate MAP almost immediately, using peripheral vasopressors.   Norepinephrine is the first-line agent, which supports circulation by improving preload, afterload, and inotropy simultaneously. 
  • If vasopressin is used, it may be most beneficial if started relatively early while on a low-intermediate dose of norepinephrine. 
  • If the blood pressure cannot be maintained by norepinephrine, consider adding an epinephrine infusion without delay. 
  • For extremely ill patients who are severely shocked and responding poorly to resuscitation it is reasonable to consider steroids sooner rather than later. 


Related posts: The Sepsis Bundle

Conflicts of Interest:  None.  

Notes

(1) Although vasopressin is typically started second in the above scheme, it should not necessarily be conceptualized as a "second-line vasopressor."   At the fixed low doses currently used for sepsis resuscitation, it might be more accurate to think of vasopressin as a low-level adjunctive neurohormone.  The term inopressors refers to agents which increase inotropy and vascular tone such as epinephrine and norepinephrine.


Image credit: Opening image from Wikipedia en.wikipedia.org/wiki/Auto_racing#/media/File:Tarlton-Drag_racing-004.jpg

Myth-busting: Azithromycin does not cause torsade de pointes or increase mortality

$
0
0

Introduction

In 2012 a NEJM article by Ray et al. reported a correlation between azithromycin and cardiovascular death.  This received extensive press and ultimately led the FDA to issue a drug safety communication warning about the risk of QT prolongation and torsade de pointes.  Subsequent studies have failed to replicate this result.  Nonetheless, suspicion lingers:  Does azithromycin increase mortality? 

Basic science & electrophysiology: Is it plausible that azithromycin would cause torsade de pointes? 

Antibiotics generally cause QT-prolongation and sudden death by blocking the hERG potassium channel and thus slowing cardiac repolarization.  Drugs are more dangerous if they have a higher affinity for the hERG channel and if they are cleared by the CYP enzyme system (rendering them susceptible to more drug interactions).  Azithromycin is not cleared by the CYP system, and has a low affinity for the hERG channel (27 times lower, for example, than erythromycin)(Giudicessi 2013).  Thus, from a molecular perspective azithromycin would be expected to be fairly safe. 

Azithromycin appears to cause a small prolongation of QTc, averaging ~10ms. Unfortunately the best study of this was performed by Pfizer and never published (it is briefly described in the package insert).  One study failed to detect any change in QT intervals at all (Shin 2014). 

More importantly, not all QT prolongation is created equal.  Some drugs may prolong the QT interval without increasing the risk of arrhythmia (Thomsen 2006).  In a rabbit heart model, supratherapeutic azithromycin levels prolong a differentcomponent of the action potential compared to erythromycin (Milberg 2002).  Rather than prolonging repolarization (a pattern which tends to cause Torsade de Pointes), azithromycin prolongs the action potential itself.  Azithromycin does not predispose to torsade de points, but instead it actually blocks the pro-arrhythmic activity of erythromycin.  The inability of azithromycin to cause torsade de pointes has been confirmed in two other studies using a dog model, even with enormous doses of azithromycin (Thomsen 2006, Ohara 2015). 

Thus, azithromycin seems to effect the heart in a fundamentally different way than erythromycin.  Azithromycin prolongs the action potential without signs of proarrhythmia, giving it the properties of "an ideal anti-arrhythmic agent." (Milberg 2002)  This doesprolong the QT interval, which is typically misinterpreted to be a sign of increased risk of arrhythmia.

Case Reports

Case reports more convincingly relate azithromycin to asymptomatic QT prolongation than actual torsade de pointes.  Indeed, every case report of torsade de pointes involved at least two other risk factors (Hancox 2013).  Given the millions of courses of azithromycin which have been prescribed, if azithromycin caused torsade de pointes one would expect to see more persuasive reports of this.

Ray WA et al NEJM 2012:  The paper that started it all

This was a retrospective correlational study of Medicaid recipients in Tennessee comparing patients who received various outpatient antibiotics (azithromycin, amoxicillin, ciprofloxacin, or levofloxacin) or patients who were not ill and not receiving any antibiotic.  Azithromycin was associated with an increase in mortality on the fourth day after starting therapy, compared either to amoxicillin or no antibiotic:


Although relegated to the paper's appendix, this same exact pattern of excess death on day #4 was observed with levofloxacin, but not with ciprofloxacin:


However, compared to patients receiving amoxicillin, patients receiving levofloxacin or azithromycin were more likely to be undergoing treatment for pneumonia or COPD.  Such patients tended to have more comorbidities and receive more medications.  Thus, use of azithromycin or levofloxacin may have merely correlatedwith a higher risk of death, rather than causingdeath. 

The fact that both levofloxacin and azithromycin correlate with an identical pattern of increased mortality on day #4 is strange.  Levofloxacin reaches steady-state levels well before day #4, so a pharmacologic effect of levofloxacin would be expected to begin earlier and last longer.  The fact that two dissimilar drugs correlate with an identical mortality pattern suggests that this mortality pattern is not being caused by either drug. 

Subsequent observational study fails to validate Ray et al. 

Svanstrom 2013 performed a similar study using a national database of Danish adults.  These authors also used patients receiving a beta-lactam as their control group (penicillin), given that these represented an acutely ill group of patients receiving a safe antibiotic.  This study found that compared to patients receiving penicillin, patients receiving azithromycin had lower mortality (rate ratio of 0.93, with a 95% confidence interval of 0.56-1.55).


The results from Ray et al and Svanstrom et al are summarized in the chart above (1).  The traditional interpretation of this data is that Ray et al found a higher mortality among the azithromycin group than the beta-lactam group, demonstrating an increased mortality due to azithromycin.  Alternatively, Svaranstrom et al found the same mortality among the azithromycin group and the beta-lactam group, demonstrating no increased mortality due to azithromycin. 

However, closer examination shows that the real difference between these studies is the behavior of the beta-lactam group (the "control" group).  Ray et al found a slightly lower mortality rate among the beta-lactam group compared to the no-antibiotic group, which doesn't make sense.  Patients receiving beta-lactams were acutely ill (unlike the no-antibiotic group), so the beta-lactam group ought to have a higher mortality.  Overall, Svanstrom's results seem more plausible, suggesting that there is no increase in mortality due to azithromycin. 

Meta-analyses of prospective RCTs

Ultimately these observational studies are primarily correlational.  As such they can only be used for hypothesis generation.  To really determine whether azithromycin causes increased mortality, prospective RCTs are needed.

Baker 2007performed a meta-analysis of prospective RCTs investigating the use of azithromycin for secondary prevention of coronary artery disease.  Six studies involving 13,778 patients were analyzed.  Azithromycin was associated with a nonsignificant trend towards reduced mortality.  


Almalki 2014 performed a meta-analysis of prospective RCTs that compared azithromycin vs. placebo for various conditions (mostly COPD, severe sepsis, and cardiovascular disease).  This study involved 12 RCTs with a total of 15,588 patients.  Many of these studies involved prolonged administration of azithromycin for up to a year.  This increased the power of the meta-analysis, which includes ~1.2 million person-days of azithromycin exposure.  There was a trend towards reduced mortality in patients receiving azithromycin. 


Conclusions


Erythromycin may prolong the QT interval and occasionally cause torsade de pointes.  Since azithromycin and erythromycin are closely related, it has often been assumed that these drugs would act similarly.  For example, a prominent review article recently lumped these two drugs together (Albert et al. 2014). 

There are two reasons that azithromycin does not share erythromycin's ability to cause torsade de pointes.  First, azithromycin's affinity for cardiac potassium channels is 27 times lower than erythromycin's.  Second, azithromycin prolongs the QT interval due to prolongation of the action potential itself, unlike erythromycin which delays repolarization.  This could actually give azithromycin anti-arrhythmic properties.  These factors explain why azithromycin has been shown to cause very small increases in the QT interval, but has notbeen convincingly linked to torsade de pointes.

The highest quality of evidence to evaluate azithromycin's safety are meta-analyses of prospective RCTs which compare azithromycin to placebo.  Such meta-analyses have shown a trend towards decreased mortality with the use of azithromycin.

At this point, the concept that azithromycin causes torsade de pointes and cardiovascular death should be discarded.  It is not supported by molecular, electrophysiological, or clinical evidence.

Epilogue: The Acontextual Fallacy

In retrospect, there was only one study that made us worry about azithromycin: Ray et al.  This study was inconsistent with preceding evidence, and has now been shown to be inconsistent with subsequent evidence as well.  So why did we care so much about this study?


This is an example of what might be called the acontextual fallacy.  Based on the prevailing use of frequentist statistics and p-values, we approach every hypothesis with a pre-test probability of 50%.  As discussed previously, Bayesian statistics might be a better approach to encourage adjustment of the pre-test probability based on prior knowledge.  Unfortunately, our current approach to interpreting papers focuses primarily on looking inward at the details of the paper.  This naturally leads to the acontextual fallacy, wherein the paper is interpreted within a vacuum. 

Avoiding the acontextual fallacy requires a thorough understanding of prior basic science and clinical data.  Without context, our opinions are easily swayed by whatever the latest study shows.  Azithromycin was safe last year, it's dangerous this year, but it will probably be safe again next year.  Unfortunately, understanding context is labor-intensive, so this component of interpreting studies is often neglected. 


  • Azithromycin and Erythromycin have different effects on cardiac electrophysiology.
  • Azithromycin does prolong the QT interval, but does not cause Torsade de Pointes.  It may actually have anti-arrhythmic activity. 
  • Azithromycin does not increase mortality. 
  • Azithromycin is a safe drug but should still be prescribed responsibly (it is not intended for anti-viral, anti-pyretic, anti-tussive, or anti-anxiety therapy). 

Conflicts of Interest: None.

Notes

(1) For comparison's sake, the rate of death for patients receiving no antibiotic has been set equal to one.  Relative rates of cardiovascular mortality are based on the primary analysis in each paper (coincidentally, Table 2 in both publications).

Image credits:
 - Opening cartoon from http://www.acphospitalist.org/weekly/archives/2013/5/8/
 - Subsequent cartoon from https://adai.files.wordpress.com/2006/12/borgman042797_600x385.jpg


Top 10 reasons to stop cooling to 33C

$
0
0
Introduction

Following the Nielsen study, many hospitals developed two protocols for temperature management after cardiac arrest (33C or 36C).  For example, the 36C protocol could be used for patients with contraindications to hypothermia (33C). With ongoing evidence emerging about hypothermia, many hospitals are abandoning their 33C protocols and using 36C for all post-arrest patients.  Although this may be old news in some locations, it remains highly controversial in the USA.  We present our opinions below, while recognizing that experts and esteemed institutions lie on both sides of this debate.

Reason #10  Focusing on depth of hypothermia may distract from the importance of duration of temperature management.

Most of the benefit of temperature management is probably due to avoidance of fever.  Thus, the duration of temperature management may be more important than the exact target temperature.  Unfortunately, excessive focus on the target temperature often overshadows the importance of the duration of temperature management.  In the past we have seen patients cooled to 33C and rewarmed over a 36-hour period, at which point the cooling pads were removed with a subsequent fever.  In efforts to maximize the "dose" of temperature management, it may be more beneficial to extend the duration of temperature management rather than lowering the target temperature.

Reason #9  Therapeutic hypothermia increases the risk of infection.

Hypothermia suppresses immune function and is associated with increased rates of bacterial infections, particularly pneumonia (Kuchena 2014).  This is a real problem, with pneumonia rates as high as 50% in some studies.  Although pneumonia has not been linked to mortality or neurologic outcomes, it may prolong the duration of mechanical ventilation and increase ICU length of stay. 

Reason #8  Therapeutic hypothermia may aggravate Torsade de Pointes.

Although uncommon, some patients present with cardiac arrest due to Torsade de Pointes (TdP).  Hypothermia causes bradycardia, QTc prolongation, hypokalemia, and hypomagnesaemia - all of which may promote the recurrence of TdP.  We have seen cases where TdP seemed to be aggravated by hypothermia, and this has also been reported in the literature (Huang 2006, Matsuhashi 2010).  It is difficult to avoid cooling patients with TdP, because the diagnosis of TdP may not be obvious initially and most hypothermia protocols are silent on this issue. 

Reason #7  Therapeutic hypothermia may compromise hemodynamics.

Therapeutic hypothermia may cause bradycardia and reduced contractility, causing reduced cardiac output and blood pressure (e.g. table below from the Nielsen study below).  Although this can usually be compensated for with vasopressors, it leaves patients with less physiologic reserve if their hemodynamics should deteriorate further.  Occasionally patients with refractory shock may require early rewarming.


The effect of hypotension on cerebral perfusion pressure is concerning.  Although hypothermia reduces intracranial pressure, it is likely that many of these patients still suffer from elevated intracranial pressures (ICP).  The combination of hypotension and elevated ICP could produce very low cerebral perfusion pressures (CPP).  Although hypothermia protocols often prescribe elevated blood pressure targets empirically to support the cerebral perfusion pressure, in practice this is often difficult to achieve. 

Recently a post hoc analysis of the Nielsen trial by Annborn et al. showed a trend towards increased mortality among patients who were cooled to 33C in the presence of shock (figure below).  In summary, hypothermia worsens hemodynamics and this could lead to worse outcomes, particularly among patients with shock.  


Reason #6TherapeuticHypothermia delays accurate neuroprognostication.

The process of cooling to 33C impairs our ability to accurately neuroprognosticate in nearly every way.  Sedatives and analgesics required to facilitate hypothermia and suppress shivering can delay the resumption of consciousness, confounding clinical neuroprognostication and prolonging the duration of mechanical ventilation.  Most other diagnostic tools are affected by cooling as well.  For example, somatosensory evoked potentials can be suppressed and have been shown in multiple case reports to return to normal several days after rewarming.  Biomarkers, particularly neuron specific enolase, are probably attenuated with hypothermia and correlate poorly with outcome in this setting.  Delays in neuroprognostication may place an excessive psychological stress on families forced to wait longer to see if their loved one will awaken.

Reason #5  Withdrawal of care following induced hypothermia can be ethically problematic.

Having embarked on a course of therapy which temporarily incapacitates the patient, there is an ethical obligation to complete the treatment course.  For example, a surgeon would not withdraw care in the middle of an operation.  Hypothermia to 33C may delay resumption of consciousness for some days.  For example, Mulder et al. 2014 reported that among patients treated with hypothermia who had a good neurologic outcome, 32% required over 72 hours to awaken.  If family members wish to withdraw care in the interim, this is ethically problematic.  It is possible that our interventionof cooling the patient to 33C could deprive the patient of the opportunity to wake up prior to terminal extubation.

Reason #4  Cognitive Offloading: Reducing focus on therapeutic hypothermia may allow us to focus more on other aspects of patient care.

Patients who have cardiac arrest are diverse and extremely ill.  These patients may have a variety of underlying processes, including myocardial ischemia, pulmonary embolism, asthma, septic shock, etc.  The presence of multiple protocols (33C and 36C) as well as the complexity of the 33C protocol may cause clinicians to focus extensively on the approach to temperature management.  This may distract clinicians from other issues, such as diagnosing and managing the underlying cause of cardiac arrest.

Reason #3  We don't fully understand what happens to the body at 33C.

Every enzyme in the body is evolutionarily optimized to function best around normal body temperature.  Hypothermia will therefore simultaneously affect every metabolic and signaling pathway.  Harmful processes will be slowed down, but so will restorative and beneficial processes.  The net effect is unclear.  The consequence of slowing down every enzyme in the human body defies prediction or understanding. 

Reason #2  Therapeutic hypothermia to 33C may be less effective in real-world settings than in clinical trials.

Cooling to 33C is a very complex and context-dependent intervention.  Its efficacy and safety depend on how well it is performed.  For example, in a small community hospital induction of hypothermia may consist of packing a patient in ice before loading them in an ambulance to transfer to a referral center.  Alternatively, at a regional referral ICU, induction of hypothermia may be accomplished with sophisticated temperature-management devices, precise electrolyte control, and careful attention to hemodynamics and cardiac rhythm. 


The studies demonstrating mortality benefit from cooling to 33C (HACA and Bernard et al.) were both performed at top research hospitals on patients presenting initially through the emergency department.  It is unclear how this may generalize to other hospitals, or to patients who are cooled prior to inter-hospital transfer.  Kim 2014showed that prehospital cooling caused higher rates of re-arrest in the field, suggesting a potential danger if cooling is not done correctly.  Morrison et al. just released a study showing that a quality improvement project which increased utilization of cooling to 33C correlated with a trend towards reduced survival to hospital discharge.  These studies raise questions about how safe cooling to 33C is outside of major clinical trials.  Since cooling to 36C is easier and safer, it probably performs better across various settings. 

Reason #1  The main reason that 33C is still being used may be status quo bias.

Currently there is no clinical evidence that 33C is superior to 36C.  Compared to 36C, 33C has a variety of additional risks and is more technically challenging.  The continued use of cooling to 33C is an example of status quo bias (discussed further by the Medical Evidence Blog).  There is a tendency to stick with established treatments, the tried-and-true.  We have worked hard for years establishing protocols and expertise in cooling patients to 33C.  When patients did well we attributed it to the hypothermia, but when they did poorly we said "well, they would have done poorly anyway" (circular logic reinforcing the status quo).  It is hard to challenge this status quo that we have strived so hard to achieve. 

Imagine, for a moment, how history might have been different if the Nielsen, HACA, and Bernard studies had all been published simultaneously in 2002.  The accompanying editorial surely would have concluded that avoidance of fever was the critical intervention.  It is difficult to imagine that there would have been any enthusiasm for cooling to 33C in that scenario.  Thus, our current practice is shaped more by inertia than by an unbiased accounting of all available evidence. 

Lack of status quo bias might also help explain why every center involved in the Nielsen trial immediately moved to a 36C target after the conclusion of the trial (Nielsen 2015).  During the trial, the status quo of cooling every patient to 33C was inadvertently destroyed.  This might have freed these centers to make a decision without bias based on prior practice patterns. 

Conclusions

The initial studies which launched therapeutic hypothermia (the HACA trial and Bernard et al.) did for post-arrest patients what the Rivers trial did for septic patients.  Instead of being ignored for a few days on the ventilator, post-arrest patients became the focus of intensive multidisciplinary management with a focus on preventing secondary brain injury.  We have seen this aggressive management approach improve outcomes.

Over time, our approach to critical care has evolved.  The PROCESS, ARISE, and PROMISE trials have informed us that many components of the Rivers protocol are unnecessary.  Similarly, the Nielsen study has informed us that we can obtain the same results while targeting a more physiologic temperature.

We remain steadfast in our dedication to immediate, precise, and intensive resuscitation of post-arrest patients.  We are not suggesting a reduction in the energy invested in these patients, but rather that such energy may be invested more wisely in other aspects of patient care.  Rather than focusing excessively on the target temperature, it may be more important to thoroughly investigate and manage the etiology of the arrest.  It is possible that the duration of temperature management could be more important than the actual target temperature, but this aspect often receives less attention.  Meanwhile impeccable supportive care must be maintained with close attention to all organ systems.


Coauthored with Ryan Clouser (@neurocritguy), a colleague with expertise and board certification in Neurocritical Care.  This post is based on a presentation by Dr. Clouser at Medicine Grand Rounds.  

Disclaimer: These are our personal opinions and do not reflect our employers or institution (full disclaimers here).  

Conflicts of interest: None.

Does central line position matter? Can we use ultrasonography to confirm line position?

$
0
0

Introduction

Suppose you just placed the central line shown above.  Does it need to be repositioned? 

I was trained that the tip of the central line must lie in the lower portion of the superior vena cava.  If the line was in the right atrium, it would cause cardiac perforation.  If the line was too high, then vasopressors would sclerose the vein.  At that time we were very interested in mixed venous oxygen saturation and central venous pressure, further mandating placement in the superior vena cava.  With newer evidence and changes in our management of sepsis, how should we position central lines now? 

What is the ideal placement of a central line?

The right atrium is fine

Traditionally atrial placement was feared due to possible risk of cardiac perforation.  However, this problem seems limited to older, stiffer central lines.  A review concluded that the risk of cardiac perforation from a catheter in the right atrium is currently an “urban legend” (Pittiruti 2015).  Hemodialysis catheters achieve better flow rates in the right atrium, so some nephrology guidelines recommend intentional placement in the atrium.  Catheter placement within the right atrium does not appear to increase arrhythmia significantly (Vesely 2003; Torres-Millan 2010).

The superior vena cava, brachiocephalic veins, and subclavian veins seem OK

Traditional teaching was that infusion of vasopressors at these sites could cause vascular damage.  However, we are now comfortable infusing vasopressors through peripheral veins as well as through midline catheters (which often terminate in the subclavian vein).  Thus any large vein is probably fine for vasopressors. 

Observational studies correlate lines placed more peripherally with increased thrombosis among oncology patients receiving permanent indwelling ports for chemotherapy.  However, these studies are not applicable to short-term non-tunneled catheters placed in critically ill patients.  For example, outpatients are much more active than ICU patients and this could lead to repetitive irritation of the vein.


It is commonly feared that a left-sided central line with its tip riding against the superior vena cava (as shown above) could eventually puncture the vessel.  However, as with cardiac perforation, there is little evidence to support this with modern catheters.  Superior vena cava perforation is indeed a complication of central line placement, but these rare events seem to occur during line placement (e.g. due to forcing deep passage of the dilator).  Modern case reports describe this as occurring immediately or within 24 hours of catheter insertion, reflecting procedural injury rather than delayed injury from the catheter itself (1).  Thus, repositioning a catheter away from the wall of the superior vena cava may be unnecessary.

Comparison with femoral lines

Malposition of femoral central venous catheters is virtually unheard of.  Why?  Because we don't check them.  If we routinely obtained an X-ray after every femoral catheter, we would discover that these lines are not always where we intended (for example, one report suggested that 4.5% lie in the lumbar vein; Gocaze 2012).  Nonetheless, nothing bad seems to happen (although a hemodialysis catheter in the lumbar vein won't work).  Overall this supports the concept that the exact location of central lines may not matter.

Bottom line on ideal line location?
“There are no conclusive studies on optimal catheter tip positioning.”
 - Frykholm et al.Clinical Guidelines on Central Venous Catheterization 2014
There is no clear evidence what the best position is.  Although “malpositioning” of central lines is common, this is well tolerated (Pikwer 2008).  These lines are placed for a short period of time and usually aren’t used for anything tremendously irritating (i.e. hydrochloric acid, chemotherapy).  Line placement in the right atrium, superior vena cava, brachiocephalic veins, and subclavian veins occurs frequently and seems to be safe.  There is less evidence to support the safety of lines aberrantly placed in the internal jugular pointing upwards towards the head (example below), so my practice is to avoid this. 


Tolerating unorthodox line position has certain advantages

Less repositioning or replacement of central lines

Placing a new central line exposes the patient to all of the risks of central line placement.  Repositioning a line is preferable, but unnecessary manipulation of the line could increase the risk of infection.  Both maneuvers cause patient discomfort, consume time, and often lead to repeated X-rays. 

Line confirmation solely via ultrasonography

If we can accept a line tip position anywhere from the subclavian vein to the right atrium, this facilitates replacement of the post-procedure X-ray with ultrasonography. 


Ultrasonographic approach to verifying central line placement
  • [a] Rule out pneumothorax with lung ultrasound.
  • [b] Examine the internal jugular veins with ultrasonography (excluding the site of catheter placement, if it was placed in one).  This should exclude a misdirected catheter pointing upwards into the head (as shown below; Zanobetti 2013).
  • [c] Inject a saline flush into the distal port of the catheter while visualizing the right atrium on echocardiography.  Appearance of bubbles within the right atrium proves that the catheter is either within the atrium or the venous system.  Although agitation of the saline using a three-way stopcock may produce more bubbles, a regular saline flush is easier and produces sufficient bubbles (Gekle 2015). 

 
Appearance of microbubbles in the heart more than 2 seconds after injection of agitated saline suggests a distal location of the catheter (e.g. within the subclavian vein; Duran-Gehring 2014).  This ought to be OK as long as catheter malposition within the internal jugular vein is excluded.  An X-ray should be considered however.

Ultrasonography has important advantages compared to chest X-ray:
  • Ultrasonography is faster, allowing immediate use of the catheter in emergent situations. 
  • Ultrasonography has been proven to have superiorperformance for the detection of pneumothorax, perhaps the most important post-procedural complication. 
  • Chest X-ray will be fooled by rare anatomic variants (e.g. persistent left superior vena cava), which may cause the line to look like it is overlying the lung or aorta.  In these situations, the saline flush test will correctly indicate that the line is within the venous system (Prekker 2010). 
  • Chest X-ray may be fooled by improperly placed lines which are nonetheless overlying the superior vena cava and thus appear to be correctly placed on a portable radiograph (e.g. this case by ScanCrit blog).  In these situations, the saline flush test should to reveal that the line is not in the venous system. 

Overall ultrasonography is probably superior to X-ray at rapidly and definitively answering the two relevant clinical questions (Is there a pneumothorax? Is the catheter in a intrathoracic vein?). 

Currently it remains the norm to obtain a post-procedure X-ray.  Eventually this practice may be abandoned, as was the practice of obtaining mandatory daily chest X-rays in every intubated patient.  This could save ~500 million dollars every year in the USA (2). 


  • The ideal placement of the central line tip is unknown. 
  • Placement of central lines within the right atrium appears safe, and is specifically recommended by some guidelines for hemodialysis catheters.
  • Central lines terminating in the brachiocephalic trunk or subclavian vein are probably fine to use for most critical care applications (other than, for example, measurement of central venous pressure or mixed venous oxygen saturation). 
  • A combination of lung ultrasonography, internal jugular vein ultrasonography, and cardiac ultrasonography with a microbubble injection usually allows immediate exclusion of pneumothorax and proof that the catheter is in a intrathoracic vein.  Ultrasonography may be superior to chest X-ray for confirmation of line placement. 

Notes
[1] For example, see case reports by: Funkai 2006, Maroun 2013, Kabutey 2013, Turi 2013, Kim 2010, Tilak 2004, Wang 2009, and Azizzadeh 2007.  There are a few case reports of delayed perforation of the superior vena cava among cancer patients receiving chemotherapy, which might relate to the vesicant properties of the chemotherapy. 
[2] It is estimated that 3 million central lines are placed annually in the United States, with a chest radiograph costing almost $200.  This figure doesn't take into account the number of dollars wasted repositioning or replacing central lines that are probably fine to begin with.  

More information
  • Bubble test by Mount Sinai Emergency Medicine Ultrasound
  • Saul et al.  The ultrasound-only central venous catheter placement and confirmation procedure.  J Ultrasound Med 2015; 34: 1301-1306.

Image credits: Torso image from https://en.wiktionary.org/wiki/torso

Proposal: Most community acquired pneumonias with extensive ultrasonographic consolidation are pneumococcus

$
0
0

Introduction with a case

A 45-year-old man was transferred to the Genius General Hospital ICU for management of pneumonia.  His chest radiograph is shown above.  Chest ultrasonography showed extensive consolidation of the entire right lower lobe with dynamic air bronchograms (video below).  He was treated with ceftriaxone and azithromycin. 

Extensive lobar consolidation with dynamic air bronchograms (air bubbles moving in the bronchi during respiration) (video by Ashley Miller). 

Subsequently his sputum gram stain returned showing gram-positive cocci in chains and clusters.  The infectious disease consultant recommended discontinuation of ceftriaxone and azithromycin, with a transition to vancomycin in case he might have MRSA.  However, if he had streptococcus pneumoniae, vancomycin would be sub-optimal therapy because it doesn’t have excellent lung penetration and serum levels are occasionally subtherapeutic.  What is the best antibiotic for this patient? 

Introduction to pneumonia typology:  Can POCUS revitalize pathology?
“Chest radiology is usually enough to confirm the diagnosis of community acquired pneumonia, whereas computed tomography is required to suggest specific pathogens.”
 - Nambu et al.  2014
Community acquired pneumonia (CAP) is a collection of several dozen pathogens that cause pneumonia.  Chest X-ray isn’t accurate enough to differentiate them, so they’re lumped together under the umbrella of CAP.  However, in some cases lung ultrasonography might allow identification of the specific type of pneumonia.  This could bring pneumonia typology from the dusty pages of medical school pathology books into clinical practice.  First, let's review the types of pneumonia. 


 [1] Lobar Pneumonia


Lobar pneumonia results from an infection centered in the alveoli.  Bacteria spread from one alveolus to adjacent alveoli, causing a dense and confluent infection.  Occasionally alveoli throughout an entire lobe may be completely filled with pus (image above). 


Radiologically, this results in dense consolidation with air bronchograms.  The process may be asymmetric, with some lobes completely filled while adjacent lobes are spared. 


Ultrasonographically, this results in a densely consolidated lung which has the appearance of liver (sonographic hepatization).  The bronchi remain open and air-filled, generating sonographic air bronchograms.  Air bubbles may be seen moving within the bronchograms during respiration, generating dynamic air bronchograms.

Microbiologically, this is most often due to streptococcus pneumoniae (pneumococcus).  Other bacteria that may cause this pattern include Klebsiella Pneumoniae and Legionella.  Proteus and Morganella might cause this pattern but are rarely causes of CAP (Washington 2007). 

[2] Bronchopneumonia


Bronchopneumonia results from an infection centered on the bronchi.  This leads to patchy and scattered involvement of small areas of lung, as infected mucus randomly migrates deeper into the lungs. 


Radiologically, this results in diffuse and patchy pattern.  Lung involvement isn’t uniform enough to produce air bronchograms. 


Ultrasonographically, this may result in focal B-lines.  Since bronchopneumonia is centered on the bronchi, it may not extend fully to contact the pleura.  In this case, it will be seen on lung ultrasonography as B-lines rather than as consolidation: 


If areas of consolidation do reach the pleura, a small-moderate sized consolidation may be seen.  On ultrasonography, small areas of aerated lung tissue between affected lobules will reflect the ultrasound beam and prevent visualization of anything deeper (the "shred sign" as shown below).  Thus, findings on ultrasonography may be less impressive than on CT scan or chest X-ray.  Note that the shred sign is seen with all types of pneumonia, so it may be unclear whether a small-moderate sized consolidation represents lobar pneumonia or bronchopneumonia. 


Microbiologically, this may occur with an extremely wide variety of bacteria including Staph, Pseudomonas, E. coli, Haemophilus influenza, Streptococcus pneumoniae, Mycoplasma, and Chlamydia.

[3] Interstitial pneumonia

Interstitial pneumonia results from infection involving the interstitium, which is the connective tissue between the alveoli.  This causes a diffuse process involving the lung tissue and especially the connective tissue septae.


Radiologically, this is best appreciated with CT scan, which shows diffuse increased density of the lungs (a hazy appearance called “ground glass opacification”) as well as thickening of the septae (causing a prominent mesh-like pattern).  On chest X-ray these features may be more subtle. 


Ultrasonographically this is often similar to the appearance of bronchopneumonia, with patchy B-lines and possibly small areas of consolidation. 


Microbiologically, this is often due to various viruses (RSV, influenza, parainfluenza, adenovirus, etc.), mycoplasma, or pneumocystis jiroveci pneumonia (PJP).

Clinical significance of ultrasonographic lobar pneumonia?

Extensive consolidation (e.g. involving the majority or entirety of a lobe) argues for a lobar pneumonia.  In practice, this is probably most often due to streptococcus pneumoniae (pneumococcus):
“Streptococcus pneumoniae… is responsible for almost all cases of lobar pneumonia and for most cases of bronchopneumonia”
 - Corrin B and Nicholson AG, Pathology of the Lungs 3rd edition 2011
Most studies of CAP show pneumococcus to be the most common identified cause, accounting for ~40% (Reynolds 2012).  Furthermore, one study utilizing trans-thoracic needle biopsy suggested that pneumococcus might account for the majority of cases where a pathogen is not revealed by standard tests (Ruiz-Gonzalez 1999).  Therefore, regardless of the radiographic pattern of CAP, pneumococcus is a reasonable guess.  For a patient with CAP and classic lobar consolidation on ultrasonography, the likelihood of pneumococcus increases even further.  Other organisms that cause lobar CAP (primarily Legionella and Klebsiella Pneumonia) are fairly uncommon. 

Lack of evidence

Unfortunately there is a lack of direct evidence correlating ultrasonographic pattern to etiologic diagnosis.  Thus, this post remains a proposal, based on extrapolation of evidence from pathology and radiology, experience, and expert opinion:
"Infectious lung injuries may have typical patterns.  Studies are coming.  Pneumonia due to Streptococcus pneumoniae often yields massive consolidation with dynamic air bronchogram, abolished lung sliding, and absence of pleural effusion."
 - Lichtenstein DA, 2010
Implications for treatment

Radiologic distinctions are not entirely reliable.  Thus, treatment is primarily based on a standard approach incorporating epidemiologic risk factors and the severity of the pneumonia.

Nonetheless, situations may arise where clinical judgment is required.  For example, in the introductory case, guidelines would suggest a standard treatment regimen for CAP (e.g. ceftriaxone and azithromycin), but microbiologic data raised the possibility of MRSA.  The ultrasonographic pattern argued against MRSA, and supported a decision to continue treatment with ceftriaxone and azithromycin.  Ultimately the urinary antigen returned positive for pneumococcus, and the sputum culture was shown to be a contaminant. 


  • The presence of extensive consolidation with dynamic air bronchograms on ultrasound may correlate with a lobar pneumonia pattern. 
  • Lobar community acquired pneumonia is most often due to Streptococcus Pneumoniae, with some cases also due to Legionella and Klebsiella Pneumoniae. 
  • Treatment decisions should be based on standard approaches utilizing epidemiology and disease severity.  However, for cases that fall on the borderline between different treatment regimens, the ultrasonographic pattern can occasionally provide a clue as to the etiology.

Stay tuned.. will have more on pneumococcus & CAP next week.  

Image credits: Opening Image courtesy of Dr. Jeremy Jones


Evidence-based treatment for severe community-acquired pneumonia

$
0
0
Introduction

Community-acquired pneumonia (CAP) remains the leading cause of infectious disease death in developed countries.  Described by Sir William Osler as "captain of the men of death," it dates back to antiquity.  However, we are only beginning to understand the best ways to treat it. 

Part 1:  The Pneumococcal meningitis story

Ceftriaxone causes bacteriolysis of pneumococcus, releasing inflammatory cell wall products that exacerbate meningeal inflammation.  In rabbits, steroid pre-treatment blocks this surge in inflammation (Lutsar 2003).  Clinically, dexamethasone pre-treatment of bacterial meningitis reduces neurologic complications, an effect which seems to be driven largely by the subset of patients with pneumococcal meningitis (De Gans 2002). 

Thus, the interactions of pneumococcus, ceftriaxone, and steroid have been established in rabbit and human meningeal infection.  There is no reason to expect that these interactions would be different in pneumonia. 

Part 2:  Understanding the effect of different antibiotics on inflammation

The most commonly used antibiotics for CAP are azithromycin, beta-lactams, and respiratory fluoroquinolones (levofloxacin and moxifloxacin).  These drugs have different effects on inflammation:

Beta-lactams:  These don’t seem to affect the immune system directly.  Beta-lactams will, however, cause bacterial cell lysis with the release of bacterial proteins (e.g., pneumolysin), triggering inflammation. 

Azithromycin:  The ability of azithromycin to suppress inflammation is widely appreciated (Parnham 2014).  Azithromycin also acts as a bacterial protein synthesis inhibitor, which may directly suppresses the production of bacterial products including pneumolysin (Anderson 2007). 

Fluoroquinolones:  Although not widely appreciated, fluoroquinolones also suppress inflammation (Dalhoff 2005).  For example, in mouse models moxifloxacin reduces inflammation incited by heat-killedbacteria, proving anti-inflammatory activity aside from any anti-microbial activity (Beisswenger 2014). 

Part 3:  Best antibiotics for severe CAP?

Little is known about antibiotic therapy for severe CAP, because nearly all studies have excluded severely ill patients.  Guidelines recommend against the use of fluoroquinolone monotherapy, on the basis of trends toward inferiority in a single RCT of severely ill patients (Leroy 2005, Mandell 2007).  Rising resistance to fluoroquinolones argues further against their use. 

Combination therapy with a macrolide and beta-lactam (e.g. ceftriaxone plus azithromycin) is supported by the greatest volume of evidence and experience.  Dual therapy with azithromycin correlates in many studies with improved mortality compared to beta-lactam monotherapy.  This correlation persists even among patients with pneumococcus, suggesting that the benefit of azithromycin may reflect its immunomodulatory properties rather than simply providing atypical coverage (Shorr 2013).  Azithromycin does not cause torsade de pointes or sudden death; this myth was debunked here.

An alternative combination which is also adherent with USA guidelines is a beta-lactam plus a fluoroquinolone.  A significant role of the fluoroquinolone in this situation might be to reduce lung inflammation, an effect demonstrated in mouse models (Majhi 2014).  However, fluoroquinolones have more side-effects than azithromycin (including delirium, tendon rupture, and higher rates of clostridium difficile). 

Thus, the combination of a reasonably broad-spectrum beta-lactam (e.g. ceftriaxone or ampicillin-sulbactam) plus azithromycin currently seems to be the best choice.  Previously, many patients with penicillin allergy were treated with fluoroquinolones.  However, penicillin-allergic patients have a negligible rate of reaction to third or fourth generation cephalosporins, so fluoroquinolone substitution is unnecessary (Campagna 2012).

Part 4:  Patients with risk factors for MRSA or Pseudomonas

There isn't enough space to really cover this.  It is worth noting that most of these patients will not actually have MRSA or pseudomonas, so the basic principles of treating severe CAP still apply.  For example, a regimen of piperacillin-tazobactam (Zosyn) monotherapy or vancomycin plus piperacillin-tazobactam ("Vosyn") is inadequate because it lacks atypical or immunomodulative therapy.  A macrolide plus beta-lactam combination remainsa good choice for the backbone of the antibiotic regimen.  If more gram-negative coverage is desired, a broader beta-lactam might be selected (e.g. azithromycin plus cefepime). 


Part 5:  Steroid therapy for CAP

The concept of using steroid for pneumonia dates back to the 1950s, but more evidence has emerged over the last five years:

Snijders et al. 2010randomized 213 hospitalized patients to receive placebo vs. 40 mg prednisolone daily for a week.  There was no difference in the primary outcome (clinical improvement at seven days), length of stay, or time to clinical stability.  Clinical deterioration >72 hours after admission was more common in patients receiving steroid.  However, when analyzed on a per protocol basis using a Fisher Exact test, the difference in late clinical failure is not significant (1)(table below).  Although the increase in late failure was emphasized in their manuscript, this is a secondary outcome of questionable statistical significance. 


Two years later these authors performed a re-analysis of the data based on whether the patients were located in the ICU (Snijders 2012).  90% of patients were not admitted to the ICU, and among these patients there was faster stabilization with steroid:

Meijvis et al 2011randomized 304 patients admitted to the medicine ward to receive placebo vs. dexamethasone 5 mg/day for four days.  The primary outcome was hospital length of stay, which was reduced in the dexamethasone group (6.5 days vs. 7.5 days, p=0.048; figure below).  There was an increase in hyperglycemia among patients receiving dexamethasone.


Blum et al 2015randomized 785 patients admitted to the hospital to placebo vs. prednisone 50 mg daily for seven days.  The primary outcome was time to clinical stability, which was improved in patients receiving steroid (3.0 vs. 4.4 days, p<0.0001; figure below).  Adjusted analysis accounting for a history of COPD did not affect this result.  This translated into a reduction in hospital length of stay by one day (p=0.012). Patients receiving steroid had a higher rate of hyperglycemia requiring insulin treatment (19% vs 11%, p=0.001), with similar rates of other complications. 


Torres et al 2015randomized 120 patients with severe pneumonia and C-reactive protein >150 mg/L to placebo vs. methylprednisolone 0.5 mg/kg Q12hr for five days.  The primary outcome was treatment failure, a composite including intubation, shock, death, and radiologic progression.  Steroid therapy caused a reduction in treatment failure, although this was largely driven by reductions in radiographic progression.


Siemieniuk 2015: This is the most recent meta-analysis, with key results as shown below.


This study failed to find evidence of significant harm (the only increased adverse event was hyperglycemia).  This is identical to safety data for steroid in septic shock (discussed previously here). 

Synthesizing data on steroid

Nearly all studies show benefit for steroid in pneumonia, with the exception of Snijders 2010.  This study reported that sicker patients treated with steroid experienced a trend towards delayed stabilization.  Alternatively, patients outside of the ICU treated with steroid improved more rapidly.  This dichotomy could reflect the unusual antibiotic scheme these authors used:  amoxicillin was used for mild-moderate pneumonia whereas moxifloxacin was used for moderate-severe pneumonia.  Overall, 39% of patients received fluoroquinolone (compared to, for example, 1% in Meijvis et al. and 13% in Blum et al.).  Since moxifloxacin has immunosuppressive properties, it is conceivable that steroid is unhelpful in combination with moxifloxacin.  This might explain why steroid was ineffective among sicker patients who were receiving moxifloxacin (2).

The two largest studies (Blum et al. with n=785 and Meijvis et al. with n=304) both found that steroid reduced the length of stay.  Meta-analysis confirmed this, while suggesting a variety of additional benefits (e.g., reduced need for intubation).  To put this into perspective, this evidence is more robust than data supporting steroid in COPD exacerbation (which is mostly based on an RCT that showed reduced length of stay by one day; Niewoehner 1999).  On a mg/kg basis, the doses of dexamethasone involved are similar to those used for symptomaticrelief of pharyngitis in kids (0.6 mg/kg; Olympia 2005).  So we're seeing a respectable benefit from a moderate and safe dose of steroid. 

However, steroid isn't for everyone.  Pending further investigation, the following caveats bear consideration:
  • Patients with contraindications to steroid were excluded from RCTs. 
  • Steroid might not be beneficial when combined with fluoroquinolone.  This combination has not been investigated adequately, with a signal of possible harm within Snijders 2010. 
  • CAP is a collection of different diseases.  Retrospective observational studies have found that steroid use correlates with increased mortality in influenza (Yang 2015).  For patients presenting during flu season with a clinical syndrome of influenza pneumonia (especially suggested by a diffuse infiltrates on chest radiograph and lack of significant consolidation on ultrasound) it may be sensible to avoid steroid.  Radiologic and ultrasonographic patterns of CAP were explored last week. 


In the absence of comparative data, a variety of steroid regimens are reasonable.  Dexamethasone has two advantages compared to other agents.  First, it has little mineralocorticoid activity, causing less volume retention.  Second, it has a long biological half-life (~2 days), so it will gradually auto-taper following discontinuation.  One reasonable regimen would be 12 mg IV dexamethasone immediately, followed by 4 mg/day IV on days #2-5 for a five-day course (3). 

Conclusions

At the most basic level, treating infectious disease is about killing bacteria.  For CAP, this isn't difficult.  It is possible to generate many suitable antibiotic regimens (e.g. levofloxacin, moxifloxacin, ceftriaxone plus azithromycin, ampicillin-sulbactam plus azithromycin, doxycycline plus ceftriaxone, etc.). 

It's more complicated though.  Antibiotics modulate the amount of inflammation that occurs as bacteria are killed (e.g. ceftriaxone causes release of pneumolysin, whereas azithromycin inhibits it).  Azithromycin and fluoroquinolones directly suppress inflammation.  Steroid may be helpful in suppressing inflammation incited by ceftriaxone, but perhaps unnecessary when combined with moxifloxacin.  Understanding this ménage a trois between bacteria, antibiotics, and the immune system may help us optimize therapy.  Killing bacteria is easy, but saving patients is tricky. 

Recent RCTs and meta-analysis support the use of steroid in CAP.  This is consistent with a benefit of steroid in meningitis, cellulitis, pharyngitis, and septic shock (4).  Bactericidal antibiotics may trigger the release of inflammatory bacterial products as bacteria are lysed, so an antibiotic-steroid combination could be ideal to allow bacteriolysis without excessive inflammation. 

Overall, for severe CAP available evidence supports a combination of beta-lactam (e.g., ceftriaxone or ampicillin-sulbactam) plus azithromycin, with steroid unless contraindicated.  Important questions remain, including exactly which patients may benefit from steroid and how to use fluoroquinolones.  We're only beginning to scratch the surface of this ancient disease. 


  • Treatment of pneumococcus with ceftriaxone increases inflammation, whereas azithromycin and fluoroquinolones have some anti-inflammatory properties.
  • For patients without risk factors for MRSA or pseudomonas, the best antibiotic selection may be the combination of azithromycin plus a reasonably broad-spectrum beta-lactam (e.g. ceftriaxone or ampicillin-sulbactam). 
  • Multiple large RCTs have demonstrated benefit of adjunctive steroid.  The most robust finding is reduced hospital length of stay, with additional evidence that steroid reduces the need for intubation.
  • For patients with severe CAP who look like they might deteriorate and require intubation, a maximally aggressive approach may consist of immediate quadruple therapy with ceftriaxone, azithromycin, steroid, and high-flow nasal cannula oxygen.


Related posts

Conflicts of Interest: None.

Notes

(1) According to the methods section of Snijders et al., "Differences between the treatment groups were compared by Chi-square or Fisher exact test for categorical variables."  This is problematic, because these two tests actually yield differentresults.  For their sample size, the Fisher exact test is probably more appropriate and it yields p-values which are slightly higher than values obtained with the Chi-square test.  Of course, the cutoff of p=0.05 is arbitrary, as discussed previously here. 

(2) It is also possible that these results were simply a statistical fluke.  Overall the results of this study are very unclear, and should probably be regarded as hypothesis-generating only.

(3) This might seem like a rather strange regimen.  Dexamethasone has a biological half-life of about 48 hours.  Therefore, a uniform course of dexamethasone (e.g. 5 mg/day for five days) will actually accumulate and reach a peak steroid level on day #5.  This isn't ideal - it doesn't make sense to increase the steroid level during the course of illness.  Based on a 48-hour half-life, in order to maintain a steady level of steroid over the first five days there should be a loading dose followed by a daily maintence dose equal to ~29% of the loading dose.  Thus, the 12-4-4-4-4 regimen will achieve a roughly stable steroid level for five days, after which it will smoothly taper off over about a week.  The total amount of steroid provided by this regimen is intermediate between Blum 2015 and Meijvis 2011.

(4) The 2014 IDSA guidelines for cellulitis make a weak/moderate recommendation to consider steroid for non-diabetic adult patients.  One RCT showed that adjunctive steroid hastened clinical resolution.  This makes sense.  With beta-lactam antibiotic therapy alone, cellulitis often gets worse before it gets better.  Perhaps this is partially due to bacteriolysis. 


Five pearls for the dyspneic patient with Guillain-Barre Syndrome or Myasthenia Gravis

$
0
0

Introduction

Guillain-Barre Syndrome (GBS) and Myasthenia Gravis (MG) are common causes of acute weakness.  About 25% of these patients may develop respiratory failure requiring intubation, so a major concern is determining who requires ICU-level monitoring and whether intubation should be performed.  Ideally it would be possible to predict with 100% accuracy which patients would require intubation, allowing pre-emptive elective intubation.  In reality such prediction is impossible, so we are often forced to carefully observe patients in the ICU until they declare themselves.

Foreword: Some comments on bedside pulmonary function tests (PFTs)

Bedside PFTs are not the comprehensive set of tests obtained in the outpatient clinic, but rather some very basic tests performed at the bedside by a respiratory therapist.  These consist of: 

  • MIP = Maximal Inspiratory Pressure.  This is the greatest negative pressure the patient can generate, often also referred to as the NIF (Negative Inspiratory Force).  It is measured asking patients to inhale as hard as they can with measurement of the negative pressure that they generate using a pressure gauge (image above).  This is a measurement of the strength of the inspiratory muscles, primarily the diaphragm.
  • MEP = Maximal Expiratory Pressure.  This is the opposite of the MIP, specifically the maximal positive pressure the patient can generate.  It is measured by asking patients to exhale as hard as they can, and measuring the positive pressure.  This is a measurement of expiratory muscle strength, which may correlate clinically with ability to cough and clear secretions.
  • FVC = Forced vital capacity.  This is the largest volume of gas that a patient can exhale.  Patients are asked to take a full breath in and then exhale maximally, with measurement of the exhaled volume.  FVC reflects a global measurement of the patient's ventilatory ability, which takes into account inspiratory and expiratory muscle strength as well as pulmonary compliance.

    Pearl #1: Do not intubate a patient solely because of poor PFTs

    It is widely believed that patients with GBS and MG who have severely impaired pulmonary function should be intubated pre-emptively.  A commonly cited rule for GBS patients is the 20-30-40 Rule: intubation is indicated if the FVC falls below 20 ml/kg, the MIP is less than 30 cm water, or the MEP is less than 40 cm water.  This is a myth.  Poor PFTs correlate with risk of respiratory failure, but are not highly specific for predicting intubation.  Unfortunately, PFTs were rapidly incorporated into patient care before being adequately evaluated, leading to a spiral of circular logic which extends from the 1980s until today: 
    The 20-30-40 rule is generally attributed to Lawn 2011.   This was a retrospective study of 114 patients with GBS admitted to intensive care at the Mayo Clinic between 1976-1996.  Significant correlations were found between poor pulmonary function tests and respiratory failure, but no single test (FVC, MIP, or MEP) predicted intubation well (table below).  Therefore, these authors proposed that patients meeting any of these three criteria should be monitored in the ICU and considered for elective intubation.  This rule was proposed in the conclusions section of the paper, but at no point in the manuscript was the sensitivity or specificity of the combined rule actually evaluated.  The closest they came to testing this was performing multivariable analysis which revealed that only FVC was an independent predictor of respiratory failure, thus challenging their own rule by demonstrating that MIP and MEP don't actually add independent information.  The 20-30-40 rule has been propagated in the literature for 14 years despite lack of clear evidence supporting it. 

    Original data on which the 20-30-40 rule for GBS was based (from Lawn 2011).  Note the poor degree of separation between patient groups based on Pimax (a.k.a. MIP) and Pemax (a.k.a. MEP).   Based on the vital capacity data above, the specificity of the 30-40-50 rule must be 83% or lower (given that 17% of patients who didn't require ventilation had a vital capacity below 20 ml/kg). 
    Pulmonary function tests are even less useful in MG because this disease has a less predictable course.  Initial pulmonary function tests are very poorly predictive of the need for intubation (Rieder 1995, Thieben 2005).  Although some critical care textbooks acknowledge this uncertainty, others recommend elective intubation based on FVC and MIP cutoffs borrowed from GBS (e.g., one prominent source recommends elective intubation when the FVC falls under 15-20 ml/kg or the MIP is under 25-30 cm, a truncated version of the 20-30-40 rule for GBS).  These cutoffs have not been validated for GBS, and thus should not be extrapolated to another disease.

    As with any critically ill patient, the decision to intubate should be based primarily on clinical assessment at the bedside.  Important elements include work of breathing, respiratory rate, oxygenation variables, and trends in these values.  Other indications for intubation would include bulbar dysfunction with an inability to handle secretions and protect the airway.  Significant hypoxemia would suggest either ongoing aspiration or atelectasis, either of which would be very concerning.  The overall tempo of the illness and clinical context, including trends in pulmonary function, provides some additional information.


    Since pulmonary function tests are poorly specific for predicting respiratory failure, pre-emptive intubation based solely on pulmonary function tests may lead to unnecessary intubations and iatrogenic harm.  A safer approach to patients with poor pulmonary function who do not clinically require intubation is close ICU-level observation with intubation only if clinically indicated.  It is also possible that noninvasive ventilation could be used to preventthese patients from failing (more below). 

    Pearl #2: Don't check the MIP or MEP

    FVC is arguably the best single test of ventilatory capability, since it integrates inspiratory and expiratory muscle strength as well as pulmonary compliance.  It is also the most reproducible test over time.  Therefore it should come as no surprise that nearly all studies have focused exclusively on the FVC in predicting respiratory failure, completely ignoring the MIP and MEP (e.g., Sunderrajan 1985, Chevrolet 1991, Sharshar 2003, Durand 2006, Kanikannan 2014).

    MIP and MEP do not add additional information to what is provided by the FVC.  In multivariable models, Lawn 2001 found that neither MIP nor MEP added statistically independent information to the FVC.  Both MIP and MEP had little ability to identify patients progressing to ventilatory failure, with substantial overlap between values obtained in patients who did and did not require intubation (table above).  Prigent 2012 found a linear relationship between VC and MIP, with MIP failing to add information to FVC.  Any impairment in inspiratory or expiratory muscle strength measured by the MIP and MEP will be physiologically integrated into the FVC, so there appears to be little added value in measuring the MIP and MEP separately. 

    MIP and MEP are more effort-dependent and less reproducible than FVC, so when tracking serial PFTs adding the MIP and MEP adds significant noise.  Some patients with bulbar involvement may have difficulty sealing their lips around the mouthpiece, leading to inaccurate MIP and MEP measurements (1).  Finally, it must be kept in mind that when the MIP and MEP are performed urgently in the emergency department or ICU, this will be less rigorous and methodical than when the same tests are performed in a formal outpatient PFT laboratory.  More information doesn't guarantee more accurate information.

    Pearl #3: Don't assume respiratory failure is due to respiratory muscle weakness

    Patients who have been labeled with GBS or MG are susceptible to anchoring bias: there is a tendency to assume that any respiratory problem encountered must be due to their neuromuscular weakness.  Once we were told that a patient transferred to Genius General Hospital with MG and respiratory failure required urgent intubation.  Indeed, the patient arrived quite dyspneic and hypoxemic.  Bedside ultrasonography showed a large right-sided pleural effusion, and further evaluation revealed that the patient had congestive heart failure with severe volume overload.  Therapeutic thoracentesis and heart failure management caused immediate improvement, avoiding the need for intubation.  Although the patient may have known respiratory muscle weakness, don't forget to look for other problems as well.  When in doubt, unholster the triple-barreled shotgun:


    Pearl #4: Consider early pre-emptive respiratory support with BiPAP or high-flow nasal cannula. 
    The pulmonary outcome of a patient with MG or GBS will often depend on the balance between the respiratory muscle strength and the work of breathing.  If the scale is tipping slightly in the wrong direction, the patient will gradually fatigue and eventually fail.  For patients who are hanging in the balance, even a small reduction in the work of breathing could be critical.  However, in order for this to succeed respiratory support must be initiated early, well in advance of respiratory exhaustion.  

    There is little high-quality evidence about BiPAP in this situation.  Three retrospective case series describe the use of BiPAP in myasthenia gravis, with avoidance of intubation in ~60% of cases (Rabinstein 2002, Wu 2009, Seneviratne 2008). Of note, Rabinstein reported avoiding intubation in 7/11 cases of myasthenia gravis, despite very low baseline FVC values (all patients had FVC <10 ml/kg).  These series noted increased failure rates among patients with significant baseline hypercapnia, suggesting that such patients may have progressed to a point of respiratory fatigue that cannot be rescued by BiPAP.  Evidence with Guillian-Barre syndrome is more sparse, with two case reports of BiPAP failure and one case report of success (Pearse 2003, Wijdicks 2006).

    There is no clinical evidence with high-flow nasal cannula.  High-flow nasal cannula can reduce anatomic dead space causing a reduction in the work of breathing as discussed here.   Although high-flow nasal cannula provides less ventilatory support than BiPAP, it may be used in patients who have contraindications to BiPAP or cannot tolerate the BiPAP mask. 


    In absence of solid evidence, a cautious trial-and-error approach may be reasonable (above).  The best metric to gauge success of these interventions may be improved patient comfort with reduced respiratory rate.   One advantage of BiPAP and high-flow nasal cannula is that it is easy to trial them, and they may be immediately discontinued if they are not helping. 

    One risk of using BiPAP or high-flow nasal cannula is that if inadequately monitored they theoretically could mask progressive respiratory failure until the patient was extremely unstable.  Therefore, this should be performed with ICU-level monitoring and close attention for any signs of clinical deterioration or worsening hypoxemia.  Patients with GBS and MG typically should not have substantial hypoxemia, so escalating oxygen requirement suggests a complication such as mucus plugging, atelectasis, or aspiration (which would usually indicate the need for intubation). 

    Pearl #5: Try not to chase dysautonomia in GBS.  However, be prepared to handle it in the peri-intubation period. 

    Patients with GBS may have dysautonomia with hemodynamic lability.  One risk involved in this situation is that if the "highs" are over-treated, this may exacerbate the "lows."  That is, if hypertension or tachycardia is treated (for example, with a beta-blocker), then the patient could subsequently have an episode of severe hypotension and bradycardia.  It is often best to avoid treating these fluctuations if possible.  If treatment is needed, a very short-acting agent may be safest so that it can be discontinued rapidly if needed.  Any factors aggravating hemodynamic swings (e.g. untreated pain, underlying hypovolemia) should be corrected.

    Dysautonomia is a particular concern in the peri-intubation period, as it may combine with hemodynamic fluctuations following intubation, amplifying the risk of hypotension.  These patients are often volume depleted due to poor oral intake, so it is sensible to assess volume status prior to intubation (e.g. with ultrasonography) and resuscitate to a euvolemic state.  Peri-intubation bradycardia is mediated by the parasympathetic nervous system, so atropine is a logical first-line treatment for this and should be close at hand. 

    • The only bedside pulmonary function test which is useful is the forced vital capacity (FVC).
    • Patients with a FVC < 20 ml/kg are at risk for respiratory failure and should receive ICU-level monitoring.
    • Intubation is typically required when the FVC falls below 10-15 ml/kg.  However, the decision to intubate is a clinical decision based primarily on ability to protect the airway, work of breathing, vital signs, overall appearance, and trajectory. 
    • For patients who are dyspneic but don't require intubation, consider trialing BiPAP or high-flow nasal cannula to see if this may improve their comfort and reduce the work of breathing.
    • Patients with GBS may have dysautonomia with wide fluctuations in blood pressure.  Avoid treating hypertension if possible, as this may exacerbate subsequent episodes of hypotension.


    Notes
    (1) In the spirit of full disclosure, I underwent a complete set of pulmonary function tests during my training, for educational purposes.  My MEP was statistically low due to difficulty with the mask seal.  I've held a grudge against the MEP ever since.  Seriously, though - if you've never had PFTs performed on yourself this is a very informative exercise.  It will demonstrate how effort-dependent these tests are, and how some maneuvers (especially the MIP) are a bit fatiguing and uncomfortable.

    Image Credits:
    http://library.westprime.com/store/index.cfm?do=DetailProduct&productid=2436&categoryid=409&ParentID=5&categoryname=Negative%20Inspiratory%20Force%20Meter
    http://etc.usf.edu/clipart/41800/41848/balance_41848.htm

    http://rsolosky.com/wp-content/uploads/2013/06/speeding-bullet-2.jpg

    Hemodynamic access for the crashing patient: The dirty double

    $
    0
    0


    Introduction with a case

    A 75-year-old man presents in transfer to the ICU for management of bradycardia and hyperkalemia.  His history is notable for hypertension with chronic use of an ACE-inhibitor.  He developed gastroenteritis due to endemic Norovirus some days prior.  Today he presented to the outside hospital with hypotension and bradycardia, with a potassium of 8 mg/dL and a Creatinine of 3 mg/dL. 

    When he arrives in the ICU he is noted to be hypotensive to 75/40 with a heart rate of 45 b/m.  He is restless and slightly confused.  He is oxygenating adequately on room air.   His only functioning access is a 22-Gauge peripheral IV in his left hand.  What is the best approach to obtaining IV access in this patient?

    How I used to manage this

    My approach used to start with placing an internal jugular central line.  This may be challenging in a confused patient with difficulty lying still, but can generally be accomplished (perhaps with an assistant gently holding the patient’s head still).  Following this procedure, I might have attempted a radial arterial catheterization to monitor blood pressure.  If this failed, then I would place a femoral arterial catheter.  All told, this process could easily take 40 minutes or longer, during which time my attention would be diverted primarily to various procedures. 

    How I might manage this currently

    Currently I begin by placing two catheters in the femoral artery and vein, immediately next to each other.  This may be done using a single sterile field.  The central venous catheter is placed first because it is generally more important.  In highly acute situations, a nurse may attach extension tubing to the central line and start using it immediately (prior to inserting the arterial catheter).  This will compromise the sterility of a portion of the sterile field, which can then be covered with a sterile towel. 

    These lines are placed with the intention that they will be “dirty” lines which must be removed within ~24 hours.  They are placed using sterile gloves, a mask, and a sterile sheet but without full sterility.  For example, this will typically occur during a resuscitation with many people at the bedside, and not everyone may be wearing a mask.  The sterile sheet will generally not cover the patient's entire body (typically the upper body and head are left exposed to allow monitoring of the patient’s ventilation and mental status).

    Advantages of emergent femoral arteriovenous access

    Speed  This is probably the fastest way for a single operator to achieve central venous and arterial cannulation.  Radial arterial catheters may be hard to place in shocky elderly patients, so the femoral arterial line provides a speed advantage compared to the radial site.  Preparing only a single site further reduces the time required.

    Patients with difficulty lying still  Many crashing patients are delirious and will be unable to hold still.  Although patients may certainly move their legs, the femoral site overall seems to be more stable than most other sites for patients who are wiggling around a bit. 

    Respiratory Monitoring  Placing a central line in the jugular or subclavian position typically requires covering the patient’s face.  For crashing patients who are not intubated, it may be safer to leave their face and chest exposed to facilitate monitoring of the respiratory and mental status.  If the patient should start vomiting or obstructing their airway, this will be noticed and acted upon immediately.

    Definitive Access  Intraosseous access is faster than placing a central line, and may be needed while awaiting central access.  However, a patient in this situation will require multiple IV medications and lab tests so an intraosseous line will not entirely solve the IV access problem. 

    Save the jugular, subclavian, and radial vessels for later   Some patients may respond to treatment rapidly, and may not require ongoing arterial and/or central venous access.  If ongoing access is needed, then "clean" lines must to be placed later, when more time is available to achieve full sterility.  One advantage of placing the dirty lines in the femoral position is that this leaves the remainder of the vasculature untouched so that the clean lines can be placed wherever is desired.

    Absolute avoidance of a pneumothorax  Iatrogenic pneumothorax is never a good thing, but there are some patients in whom a pneumothorax would be particularly dangerous (e.g., a patient with severe diabetic ketoacidosis who is struggling to compensate for their acidosis from a respiratory standpoint).  An experienced operator can usually place an ultrasound-guided internal jugular catheter with a near-zero pneumothorax rate, but if the patient is unable to lie still then nothing can be guaranteed.  Thus, for a crashing agitated patient who would be unable to tolerate a pneumothorax, femoral access may be a rational choice. 

    It’s OK to be dirty, as long as you come clean about it

    During the resuscitation of a patient who is very unstable, it is difficult to achieve complete sterility (e.g. caps and hats for the entire team, full body draping, etc.).  Thus, most central lines placed in this situation may not be 100% sterile.  If a line is placed in this situation with <100% sterility and is  incorrectly designated as a “clean” line then it may remain in place, causing a line infection.

    Alternatively, if a line is emergently placed without full sterility but it is accurately designated as a “dirty” line, then this is not a problem.  The line will be removed before a line infection could occur.  Linguistically it sounds wrong to put in a “dirty” line, but this is actually a rational approach to central access in a crashing patient. 

    Beware of the intubation trap for hemodynamic crashes

    When approaching an unstable patient, one consideration is always whether the airway should be secured.  As discussed earlier, if there is concern that the patient is going to lose their airway, it may be reasonable to err on the side of intubation.  A previous post discussed rapid sequence intubation and procedurization as an approach to a patient with respiratory failure.


    However, for patients with a primary cardiac problem and severe hypotension, immediate intubation is extremely dangerous and may precipitate cardiac arrest.  This patient’s problem is not respiratory failure.  Intubation will not solve their problem, but will actually make it worse (adding sedation and positive-pressure ventilation are likely to worsen the patient's hemodynamics).  When facing a crashing patient with a primary hemodynamic problem, there may be a tendency to start by securing the airway ("start with the ABCs"), but it is often best to avoid intubation if possible. 

    To ultrasound or not to ultrasound?

    The debate about whether or not to use ultrasonography for central lines is getting a bit stale at this point.  My preference is to use ultrasonography for double femoral cannulation if possible.  Setting up the ultrasound machine takes a little time up-front, but this may improve the speed and accuracy of both procedures. 

    Approach in morbid obesity

    Although femoral access is generally straightforward, it can be challenging in the morbidly obese.  Certainly, the site of vascular access will vary between different patients and this must be determined on a patient-by-patient basis.  When in doubt, examining the vessels with ultrasonography before starting the procedure takes a few seconds, and can provide a good concept of how difficult the procedure will be.  If a femoral approach is chosen in a patient with morbid obesity, it may be extremely helpful to retract the pannus (using tape or an assistant) in order to open up the inguinal crease. 


    • For a crashing patient who needs immediate arterial and venous access, one approach is to place adjacent catheters into a femoral artery and vein.
    • With the exception of severe obesity, this is generally fast and technically straightforward (especially with the use of ultrasonography).
    • It may be difficult to place a completely sterile central line in the middle of a resuscitation.   In an emergency it is reasonable to intentionally place "dirty" lines with a plan of removing these within ~24 hours.   Placing "dirty" lines in the femoral position leaves the remainder of the vasculature available for placing a sterile line when time allows.   
    Image credits
    Femoral artery and vein: http://upload.wikimedia.org/wikipedia/en/3/34/Femoral_triangle.gif
    It's a trap: http://knowyourmeme.com/memes/its-a-trap

    High-flow nasal cannula for apneic oxyventilation

    $
    0
    0

    Introduction

    Last summer I wrote a postabout preoxygenation and apneic oxygenation using high-flow nasal cannula (HFNC).  At that point there was no evidence supporting it, so the post was based primarily on the physiology of HFNC.  Recently two papers were published supporting the use of HFNC for preoxygenation and apneic oxygenation (Patel 2015, Miguel-Montanes 2015).  The surprising part is that Patel et al additionally found that high-flow nasal cannula provided apneic ventilation.

    Patel A et al.  Transnasal humidified rapid-insufflation ventilator exchange (THRIVE): a physiological method of increasing apnoea time in patients with difficult airways.  Anaesthesia 2015; 70:323.

    This is a case series of 25 patients undergoing hypopharyngeal or laryngotracheal surgery judged to be at high risk of peri-intubation desaturation based on both a predicted difficult airway plus obesity or underlying cardiorespiratory disease.  Preoxygenation and apneic oxygenation was performed using HFNC at 70 liters/minute.  The median apnea time was 14 minutes with an inter-quartile range between 9-19 minutes.  No patient desaturated below 90% nor had an apnea time under five minutes. 

    These apnea times likely under-estimate the maximal apnea time that might be expected for most patients.  The study investigated a highly selected group of patients at high risk for desaturation.  Furthermore, apnea was usually terminated when the airway was secured, preventing us from knowing how much longer the patient might have gone before desaturating. 

    The most significant part of this paper may be that HFNC reduced the rise of carbon dioxide over time by a factor of three compared to prior studies:
    Classical apneic oxygenation with low-flow oxygen improves oxygenation without affecting ventilation.  Without ventilation, PaCO2 increases about 8-16 mm in the first minute of apnea and then at a rate of about 3 mm/hg/min (Weingart and Levitan 2012).  Thus, as a rough estimate, a patient with a bicarbonate of 24 can remain apneic for about 17 minutes before their PaCO2 reaches 100mm and their pH falls to 7.0.  In contrast, Patel et al found some patients who were able to remain apneic for over 30 minutes with PaCO2<100 mm (figure below).  In one case, a patient was left apneic for 65 minutes and the entire surgical procedure was performed during the apnea time.

    Low-flow apneic oxygenation provides no ventilation

    Low-flow apneic oxygenation works via aventilatory mass flow.  The rate of oxygen removal in the alveoli exceeds the rate of carbon dioxide entering the alveoli, generating negative pressure.  This causes a slow, likely laminar flow of oxygen gas from the nasal cannula into the oropharynx and trachea and finally into the alveoli (figure below).  This slow, steady inward flow of gas provides oxygenation without any ventilation.  


    The physiology of apneic ventilation

    In order to provide apneic ventilation, HFNC must be operating in a fundamentally different way.  The ability to perform apneic ventilation with low-flow oxygen insufflated into the trachea has been known for decades.  In 1985, Slutskydemonstrated that in paralyzed dogs, a mere 2 liter/minute of oxygen continuously insufflated into the trachea was sufficient to maintain oxygenation and ventilation indefinitely: 


    The physiology underlying this is complicated.  Within some of the larger airways, turbulent flow could generate a cascade of turbulent vortex flows extending into smaller airways (figure below).  Each vortex could communicate with the vortex above and below it, like a series of interlocking gears. 


    Beyond these airways, there are smaller airways with little flow where gas transport may occur by molecular diffusion.  Ventilation through these smaller airways may also be enhanced by cardiac pulsation of the lung (Slutsky 1985).  There is probably more to it than this, but suffice it to say that it has been validated in several experiments and somehow it works. 

    HFNC could take advantage of this mechanism if even a very small fraction of the flow was transmitted from the nose to the trachea (figure below).  For example, Rudolf 2013 found that insufflating only 0.5 liters/minute into the trachea of patients undergoing endoscopy reduced the rate of CO2 rise by ~50% to 1.8 mm/min.  Thus, if HFNC could achieve a flow of just 1 liter/minute in the trachea this might be sufficient to achieve significant ventilation:
    Oxyventilation: Apneic ventilation improves apneic oxygenation

    In general, it is useful to think about a patient's oxygenation and ventilation status separately.  However, ventilating the lungs with pure oxygen will improve oxygenation as well.  Rather than ventilating the lungs with air (in which case removed carbon dioxide is largely replaced by nitrogen), ventilation with oxygen should remove carbon dioxide and replace it with oxygen.  As such, it is difficult to tease these two processes apart and it may be best to conceptualize them as a single process: oxyventilation.

    The marriage between ventilation and oxygenation derives from Dalton's Law of Partial Pressures, which states that the sum of all partial pressures in the alveolus must equal atmospheric pressure (equation below).  If the alveolus is ventilated with oxygen, then any decrease in the PCO2 due to ventilation will force the PO2 to increase:


    For example, after 10 minute of apnea, HFNC will lead to an alveolar PaCO2 which is about 20mm lowerthan it would be using low-flow apneic oxygenation (based on data from Patel et al).  This 20mm of pressure, rather than being occupied with carbon dioxide, will be replaced with oxygen, thereby increasing the PaO2 by 20mm. 

    Directions for future research

    The ability of HFNC to provide oxyventilation, if confirmed, would be profound and extremely important.  This could certainly improve the safety of endotracheal intubation.  It could also have many other implications, for example regarding procedural sedation.  Imagine being able to safely render a patient apneic for a couple of minutes to allow for cardioversion or joint manipulation. 

    It might be useful to combine high-flow nasal cannula with a nasopharyngeal airway in order to maintain upper airway patency and deliver high-flow oxygen more deeply into the airway (figure below).  A nasopharyngeal airway could avoid irritating the more delicate tissues of the nose, which might allow delivering gas at a higher flow rate.  A nasopharyngeal airway would also direct the flow exactly where it needs to go - right into the larynx and trachea.  If a combination of HFNC and a nasopharyngeal airway could achieve a tracheal flow of several liters/minute, it might be capable of maintaining oxygenation and ventilation indefinitely. 


    Is HFNC preoxygenation ready for prime time?

    Unfortunately, the new evidence on HFNC for apneic oxygenation doesn't reveal much about its exact power at maintaining oxygenation.  Miguel-Montanes 2015 demonstrated that HFNC appeared more effective than a non-rebreather mask at 15 liters/minute.  However, since non-rebreather masks generally provide at most ~70% FiO2, the superiority of HFNC to this approach was entirely predictable. 

    Although Patel et al requires validation, it is quite compelling.  They selected a very challenging group of patients (BMI up to 52) and had excellent outcomes with them.  The ability to maintain over an hour of apnea time without life-threatening hypercapnia is an impressive feat which would probably be impossible with traditional apneic oxygenation.  Although indirect evidence, this success with ventilation implies improved power to oxygenate as well.  It must be noted that Patel et al involved patients undergoing elective anesthesia, so these findings may not apply to patients with active lung disease such as pneumonia, with obstructing mucus and secretions.   

    Thus it remains unclear to what extent HFNC should be used for preoxygenation.  Overall I agree with Scott Weingart's recent podcast on preoxygenation.  We have been using the Weingart/Levitan approach of combining a non-rebreather facemask at 15 liters/minute plus nasal cannula at 15 liters/minute at Genius General Hospital for a while now, with excellent results.  HFNC takes some effort and cost setting up, so it may not be worthwhile using it routinely just for the purpose of preoxygenation.

    There may be selected cases, however, where HFNC could be worth utilizing for preoxygenation and apneic oxyventilation.  One example of this might be a patient with normal lungs and an anticipated anatomically challenging airway (e.g., prior neck radiation).  Of course, for very high-risk cases awake intubation may be safer.  Exactly where HFNC might be integrated into clinical practice remains to be defined.

    Conclusions

    The expanding use of noninvasive ventilation and HFNC may be the most important new development in the management of respiratory failure over the last several years.   We are only beginning to appreciate exactly how these devices work, and how best to use them.

    Patel's study suggests that HFNC provides apneic oxyventilation (ventilation with oxygen, simultaneously supporting oxygenation and ventilation).  This implies that high-flow apneic oxygenation operates in a fundamentally different mechanism than low-flow apneic oxygenation.  The physiology by which delivery of low amounts of oxygen to the trachea may support oxygenation and ventilation has already been described, suggesting that HFNC may be taking advantage of this mechanism.   If this finding is confirmed, it would have broad implications for the use and development of high-flow oxygen devices in the future. 

    Currently the role of HFNC for preoxygenation remains unclear.   Further studies are needed, ideally including direct comparison with a preoxygenation method that provides close to 100% FiO2 (e.g., noninvasive ventilation or a combination of non-rebreather at 15 liters/minute plus nasal cannula at 15 liters/minute).


    Management of severe hyperkalemia in the post-Kayexalate era

    $
    0
    0

    Introduction

    There is increasing recognition that sodium polystyrene sulfonate (Kayexalate) is ineffective for the immediate management of severe hyperkalemia (Kamel 2012).  With Kayexalate gone, there seems to be a gap in our treatment regimen.  I often encounter residents who know that Kayexalate isn't helpful, but aren't sure exactly how to treat hyperkalemia without it.

    The good news is that abandoning Kayexalate allows us to focus on a more effective approach to hyperkalemia: renal potassium excretion (kaliuresis).  Anyone experienced in diuresis knows that it causes a drop in the potassium level, at times requiring frequent monitoring and aggressive potassium repletion.  It's time to use this to our advantage. 

    PART 1: The Bicarbonate Debate       

    Theory: Three mechanisms whereby bicarbonate could decrease serum potassium

    Mechanism #1: Transcellular shift into skeletal muscle  Most of the body's potassium is located in skeletal muscle cells, so small shifts of potassium between the serum and muscle cells can strongly affect the serum potassium.  Sodium bicarbonate may cause shifting of potassium into muscle cells via various mechanisms.   By alkalinizing the serum, bicarbonate may indirectly cause movement of potassium into cells via an H+/K+ exchange mechanism (figure below).   Additionally, bicarbonate may be directly transported into muscle cells along with potassium (Aronson 2011).   

    Mechanism #2: Renal Excretion  Acute metabolic acidosis impairs potassium excretion by the kidney, whereas metabolic alkalosis facilitates potassium excretion.  This is largely due to regulation of potassium channels in the distal nephron, which are down-regulated by acidosis and up-regulated by alkalosis.  Metabolic alkalosis additionally inhibits proximal tubule reabsorption of sodium bicarbonate, which facilitates potassium excretion by increasing distal sodium concentration and flow rate (Aronson 2011): 
    Potassium secretion as measured in a rat nephron micropuncture model, in response to luminal fluid of varying composition (Amorim 2003).  Alkalosis caused a slight increase in potassium secretion.  Increasing the luminal bicarbonate concentration at a fixed pH of 7.0 caused a greater increase in potassium secretion.  Thus, potassium secretion may be independently stimulated by both alkalosis and also by increased sodium bicarbonate excretion in the urine.

    Mechanism #3: Dilution  If a large volume of isotonic bicarbonate is given, there may be a decrease in potassium concentration due to a dilutional effect.  Consider for example a hypothetical 70-kg man with a potassium of 8 mM and an extracellular fluid volume of 15 liters.  Temporarily ignoring any effect of potassium shifts, infusion of two liters of isotonic bicarbonate would be expected to decrease his potassium to 7.1 mM simply by expanding his extracellular fluid volume to 17 liters.

    Hypertonic bicarbonate appears ineffective


    Traditional management of hyperkalemia has involved using ampules of hypertonic 8.5% sodium bicarbonate (which has an osmolality of 2000 mOsm, about seven times higher than plasma).  Unfortunately, hypertonic bicarbonate has been uniformly ineffective in multiple studies (Blumberg 1988Blumberg 1992, Kim 1996Kim 1997).   

    Hypertonic fluids are known to increase serum potassium levels due shifting potassium out of cells (Aronson 2011, Conte 1990).  One of the mechanisms explaining this is a phenomenon called solute drag.  Increasing the plasma tonicity causes cells to shrink, which increases the intracellular potassium concentration.  Equilibration with serum then causes potassium to leave the cells (thereby being "dragged" out of the cells following water).

    Precisely why hypertonic bicarbonate fails to work is unclear.  It is likely that its hypertonic effects negate any benefit of the bicarbonate.  It could also be that evaluating the immediate effect of hypertonic bicarbonate relies solely on mechanism #1 above (thus failing to take advantage of mechanisms #2-3).

    Bicarbonate appears ineffective in the absence of acidosis

    Bicarbonate also appears to be ineffective in patients without significant pre-existing metabolic acidosis.  Blumberg 1988 and Allon 1996 found that even isotonic bicarbonate was ineffective among patients undergoing chronic hemodialysis with an average initial bicarbonate of 22 mEq/L.  There are various possible explanations for this.  The Na/H exchange channel in skeletal muscle may be up-regulated by acidosis and down-regulated by alkalosis (figure below).  HCO3-/K+ cotransport is partially driven by intracellular acidosis which creates a gradient favoring bicarbonate entry into cells, so this mechanism may also be less effective in the absence of acidosis (Aronson 2011).


    Isotonic bicarbonate may be effective in patients with metabolic acidosis

    Available evidence suggests that large-volume isotonic bicarbonate infusions may benefit patients with pre-existing metabolic acidosis (2).  In 1977, Fraley evaluated the effect of infusing one liter of D5W containing 89 mM or 134 mM sodium bicarbonate over 4-6 hours to 18 hyperkalemic patients with baseline metabolic acidosis.  Patients with persistent hyperkalemia were treated with additional bicarbonate.  As a control, some patients were initially treated with D5W alone (which was ineffective).  There was a linear relationship between the decrease in serum potassium and the increase in serum bicarbonate, with serum potassium decreasing by about 0.15 mM for every 1 mEq/L increase in bicarbonate.  Patients were retrospectively divided into two groups depending on whether or not serum pH increased during bicarbonate therapy.  Both groups demonstrated a decrease in potassium with bicarbonate therapy (figure below).  There was no relationship between the renal potassium excretion and the change in serum potassium, suggesting that renal excretion was not primarily responsible.  This study has many flaws, including the use of varying concentrations and volumes of serum bicarbonate.

    Relationship between changes in blood bicarbonate and serum potassium among five patients with increasing serum pH (left) and nine patients with stable pH (right; Fraley 1977).  Multiple data points are present for each patient, representing different time points during the bicarbonate infusion.   There was no statistical difference between regression lines relating these values in the two patient groups (both regression lines are shown on the right).   

    In 1991, Gutierrez evaluated the effect of isotonic bicarbonate, hypertonic bicarbonate, normal saline, or hypertonic saline among patients with chronic renal failure and metabolic acidosis (figure below).  At a dose of 1 mEq/kg, hypertonic bicarbonate had no effect, whereas isotonic bicarbonate caused an average decrease in serum potassium of 0.35 mM (p<0.05).   Although some have interpreted this data to indicate that bicarbonate is ineffective, 1 mEq/kg is a lower dose of isotonic bicarbonate than other investigators used.  The 0.35 mM decrease in serum potassium observed here in parallel with a 3 mEq/L increase in serum bicarbonate is consistent with results obtained by Fraley (above) and Blumberg 1992 (below).   Note that saline tended to increase the potassium level - this is discussed further below.
    In 1992 Blumberg evaluated the effect of bicarbonate in 12 patients with end-stage renal disease and metabolic acidosis on chronic hemodialysis.  Patients first received 240 mM of 8.4% bicarbonate over an hour (equal to about five ampules of bicarbonate).  This was followed by an infusion of 900ml of isotonic bicarbonate over the next five hours.  Hypertonic bicarbonate had little effect on the serum potassium over the first hour.   However, the infusion of isotonic bicarbonate over the next five hours did seem to decrease the serum potassium (figure below).  These authors calculated that about half of this decrease in potassium may have been due to a dilution effect by expanding the extracellular fluid volume (Mechanism #3 above).   Unfortunately this study is flawed because it is unclear whether the decrease in potassium was due to the isotonic bicarbonate infusion or a delayed effect of the hypertonic bicarbonate.


    Conclusions about bicarbonate?

    Ultimately the literature regarding bicarbonate remains unsatisfying.  All studies above, aside from Fraley 1977, investigated patients with chronic end-stage renal disease and moderate hyperkalemia attending routine hemodialysis.  Results from this patient population may not be generalizable to patients presenting with acute life-threatening hyperkalemia who often have more severe acidosis and acute renal failure.  For example, it is possible that patients undergoing chronic hemodialysis could have chronically elevated intracellular potassium levels, and thus be less able to shift additional potassium intracellularly.  Indeed, end-stage renal disease is known to impair extra-renal potassium metabolism in numerous ways, including impaired function of Na-K channels (Ahmed 2001).

    Overall it is impossible to reach any definite conclusion based on existing evidence.  Theoretical and experimental evidence suggest that isotonic bicarbonate may be beneficial among patients with metabolic acidosis.  Potassium might decrease by roughly 0.15 mM for every 1 mM increase in bicarbonate, suggesting that a large volume of isotonic bicarbonate may be required (e.g., a sufficient volume to increase serum bicarbonate levels by 5-10 mM, roughly 1-2 liters)(1).  This cannot be done in a patient with volume overload.  The ideal candidate for bicarbonate therapy would be a patient with volume depletion, hyperkalemia, and metabolic acidosis, because isotonic bicarbonate may improve all three of these problems simultaneously.  

    PART 2: Avoid normal saline


    What about volume resuscitation of a patient with hyperkalemia who doesn't have metabolic acidosis?  Although normal saline is traditionally used in this situation, it has been proven in three randomized controlled trials to induce a hyperchloremic metabolic acidosis and worsen hyperkalemia (not including Gutierrez 1991 discussed above; evidence explored here).  In contrast, Lactated Ringers is safe to use in hyperkalemic renal failure and is proven to cause less hyperkalemia than normal saline.  Of everything discussed in this post, the danger of normal saline is supported by the strongest evidence (three independent prospective double-blind RCTs).

    PART 3: Diuresis vs. Dialysis

    Previously it was believed that there were three routes to emergently remove potassium from the body: stool (using Kayexalate), urine (kaliuresis), and dialysis.  Removal of Kayexalate from the treatment algorithm simplifies matters and allows us to focus on kaliuresis, which can be extremely effective and is often under-utilized.  For example, a recent review article on hyperkalemia failed to mention diuresis at all (Elliott 2010).


    For a patient with life-threatening hyperkalemia, it is often reasonable to make a single attempt at kaliuresis prior to proceeding to dialysis or simultaneously to pursuing dialysis (e.g., while arranging transfer to a hospital with dialysis capabilities).  Of course in some situations such as chronic anuric renal failure, kaliuresis is unlikely to succeed, so it may be more sensible to proceed immediately to dialysis.


    Most diuretics cause potassium loss in the urine.  A loop diuretic (e.g., furosemide) is the most potent agent, and is generally used as the backbone of the diuretic regimen.  For patients with life-threatening hyperkalemia and renal insufficiency, it may be reasonable to use multiple diuretics, as these will operate in a synergistic fashion by blocking potassium reabsorption at different sites in the nephron (figure above).  The combination of a loop diuretic and thiazide is commonly used in diuretic-resistant patients, with increased efficacy and potassium loss (Jentzer 2010).  Acetazolamide may be especially kaliuretic because it increases bicarbonate delivery to the distal nephron (Weisberg 2008, Goodman & Gillman 12e Chapter 25).   

    There is no evidence regarding the number or dose of diuretic which should be used.  For life-threatening hyperkalemia there is generally time for a single attempt at kaliuresis.  Therefore, typically this attempt is fairly aggressive.  For a patient with renal dysfunction who is expected to respond poorly, high doses of multiple agents may be considered (e.g., intravenous furosemide plus intravenous chlorothiazide)(3).  The risk of over-diuresis and electrolyte depletion may be minimized with close monitoring of electrolytes and repletion as needed.  Urine output and volume status must be carefully monitored, with ongoing volume administration to return urinary losses and maintain a euvolemic state.

    In the absence of evidence, selection of the number and dosage of diuretics must be based on clinical judgement.  For example, at Genius General we once admitted a pleasant elderly man with chronic renal failure complicated by hyperkalemia causing bradycardia and shock.  He wished never to undergo dialysis and was not amenable to this therapy even temporarily.  Given probable death if he failed to respond promptly to diuretics, he was treated with maximal kaliuresis (200 mg i.v. furosemide, 500 mg i.v. acetazolamide, 1000 mg i.v. chlorothiazide, and isotonic bicarbonate).  He responded well, and ultimately required potassium and fluid repletion.  In retrospect, he likely would have responded to a less aggressive diuretic regimen.  However, in the face of life-threatening hyperkalemia, it may be safer to err on the side of over-treatment followed by meticulous replacement of electrolytes and fluid as needed. 

    • Neither Kayexalate nor hypertonic bicarbonate (i.e., ampules of 8.4% bicarbonate) are effective for emergent treatment of hyperkalemia.
    • Isotonic bicarbonate may be effective for patients with metabolic acidosis.  Unfortunately this requires a large volume of fluid, and cannot be used in patients with volume overload.  
    • Normal saline is proven to worsen hyperkalemia and should be avoided.  For a hypovolemic patient without metabolic acidosis, lactated ringers is a reasonable fluid choice.
    • Kaliuresis (facilitating urinary potassium excretion with diuretics) may be quite effective in patients with residual renal function.  Otherwise, emergent dialysis is generally needed.

    Additional resources
    • Podcast by Scott Weingart about treatment of severe hyperkalemia from 2010.   
    • Review article by Weisberg regarding the management of severe hyperkalemia.   Although this article is now seven years old, it remains one of the best reviews out there. 
    • Is Kayexalate effective?   This has been discussed in EMLyceumEMCritPrecious Bodily Fluids, and Kamel 2012.   There's not much I can add to this discussion that hasn't already been said, so if you're interested in the Kayexalate issue please see these sources.
    • Prior post on pH-guided resuscitation describes the rationale for choosing different fluids during resuscitation in order to optimize the final acid-base status.  
    • The effects of pH on renal handling of potassium is reviewed by Aronson 2011.   This is a very detailed article with lots of information about various potassium channels.  


    Notes

    (1) The volume of isotonic bicarbonate required may be estimated by calculating a patient's bicarbonate deficit using MDCalc and then dividing by 150 mEq to calculate the number of liters of isotonic bicarbonate this equals.   For example, a 70-kg man with a bicarbonate of 15 mEq/L has a bicarbonate deficit of 252 mEq.   Given that every liter of isotonic bicarbonate contains 150 mEq of bicarbonate, this deficit correlates to roughly 1.7 liters of isotonic bicarbonate.   Therefore, for this patient 1.7 liters of isotonic bicarbonate would be expected to increase his bicarbonate from 15 mEq/L to 24 mEq/L, an increase of 9 mEq/L which would be expected to decrease potassium by roughly 9 mEq/L x 0.15 = 1.35 mM.   These are all very rough calculations, but may provide a general concept about how much bicarbonate is required.  

    (2) Isotonic bicarbonate contains 150 mEq/L of sodium bicarbonate.   This is commonly obtained by adding 3 ampules of sodium bicarbonate (containing 50 mM/ampule) to a liter of D5W.   Further discussion of isotonic bicarbonate may be found on a prior post regarding pH-guided resuscitation.

    (3) I'm not aware of any direct evidence upon which to base this selection.   Theoretically, acetazolamide may be expected to be more kaliuretic than a thiazide diuretic.  However, acetazolamide overall may be a less powerful agent, and less effective at eliciting diuresis in a patient with renal dysfunction.  A common practice of nephrologists and intensivists at  Genius General Hospital has been to combine intravenous furosemide and chlorothiazide, and this seems to be effective.   

    Image credits:
    Image of bicarbonate ampule: http://dailymed.nlm.nih.gov/dailymed/fda/fdaDrugXsl.cfm?setid=c1ab9fff-c97b-4fca-b7a2-2378045bc799&type=display
    Diagram of nephron: http://www.boomer.org/c/p2/Exam/Exam9905/Exam9905-1.html


    Do CT scans cause contrast nephropathy?

    $
    0
    0
    Introduction

    In April 2013 a series of articles in Radiology debated whether contrast nephropathy still exists using modern contrast dye.  Two years later, the controversy remains.  This is a daily conundrum when managing critically ill patients: one radiologist will urge us to use contrast, while the next radiologist will caution us against using contrast.


    The existence of clinically significant contrast nephropathy is based upon three suppositions.  First, contrast dye should cause an elevation of serum creatinine.  Second, this elevation of serum creatinine should indicate genuine kidney injury (rather than random fluctuations in creatinine).  Third, kidney injury should result in clinically meaningful outcomes (e.g. dialysis or death).  This post examines new evidence about these suppositions. 

    BackgroundUnderstanding types of contrast dye and procedures

    Contrast for cardiac catheterization vs. CT scanning

    The risk of kidney injury following cardiac catheterization is higher than the risk of a contrasted CT scan for many reasons (e.g., catheterization may dislodge athero-emboli leading to renal failure, and cardiac patients often have tenuous renal perfusion).  This post is about the use of intravenous contrast dye for CT scanning.

    All contrast dyes are not created equal

    Contrast dyes are divided into three groups based on their osmolarity.  High-osmolar contrast medium (HOCM), the oldest and most nephrotoxic group, is no longer used.  Most studies are currently performed with either low-osmolar contrast medium (LOCM) or iso-osmolar contrast medium (IOCM):

    Meta-analysis of prospective RCTs comparing LOCM to IOCM shows that the degree of nephrotoxicity varies between different types of LOCM.  Iohexol and Ioxaglate are more nephrotoxic than IOCM, while remaining LOCMs are not (figure below from Reed 2009).  This was confirmed in the most recent meta-analysis of 42 RCTs that included 10,048 patients (Biondi-Zoccai 2014)(1).   


    These meta-analyses combined data from cardiac catheterization procedures with data from CT scans.  A large retrospective study of CT scans similarly found that Iohexol was associated with higher rates of nephrotoxicity than Iodixanol (Bruce 2009):


    (1) Does contrast dye cause an increase in creatinine?

    The vast majority of papers about contrast nephropathy have focused on whether creatinine increases after administration of contrast dye.  Most studies were performed without a control group, based on the assumption that any increase in creatinine must be due to contrast nephropathy.  However, some investigators realized that creatinine elevations are common even in the absence of contrast dye. 

    McDonald 2013 performed a meta-analysis of thirteen observational studies comparing patients who had received contrasted CT scans versus patients who received noncontrasted CT scans.  This study found no difference in creatinine elevations between the two groups.  However, this data may have been confounded by avoidance of contrast administration in patients at higher risk of kidney injury.   

    In attempts to make sense out of retrospective observational data, two propensity-matching studies evaluated the relationship between contrast and creatinine elevations (2).  Propensity-matching is a complex statistical approach intended to remove multiple confounding variables from observational data.  These two studies arrived at opposite conclusions.  Davenport 2013 found that contrast dye was nephrotoxic among patients with baseline GFR<30 ml/min, whereas McDonald 2014found no relationship between contrast and changes in creatinine among any subgroup:


    Comparing these two studies may explain why they reached different conclusions regarding patients with baseline GFR<30 ml/min.  First, Davenport's study is woefully underpowered in this subgroup (with one group as low as n=44, compared to McDonald's groups which are all >700 patients).  Second, Davenport's study seems to have broken the 1:1 propensity matching in order to compare two sub-groups of different sizes (unlike McDonald's study, which preserves 1:1 propensity matching throughout).  Failing to analyze propensity-matched data in a pair-wise fashion is a common error (Austin 2008).  Overall, McDonald's study appears better powered and better designed, with tighter 95% confidence intervals and more credible results.  Another possible explanation for the difference in results may be more systematic avoidance of Iohexol among patients at risk for renal failure in the McDonald study (3). 

    McDonaldalso performed a counterfactual analysis of patients who had received both a contrasted CT scan and a non-contrasted CT scan at different times.  Using the patients as their own control, there was no difference in rate of kidney injury following the contrasted versus the uncontrasted scan.

    (2) Do increases in creatinine correlate with actual kidney injury?

    Defining contrast nephropathy on the basis of elevated creatinine 2-3 days after receiving contrast is convenient for investigators, but it is unclear what these creatinine elevations really mean (4).  Many studies have reported that although some patients develop contrast nephropathy, the average creatinine among all patients is either stable or improved (e.g., Azzouz 2014, Lencioni 2010, Sandstede 2007).  This raises the possibility that we may be observing random variations in creatinine following a normal distribution, and labeling the outliers as having "contrast nephropathy:" (5)


    Schmalfuss 2014 found that among 508 patients receiving IOCM, 14 had an increase in creatinine satisfying their definition of contrast nephropathy.  However, eight patients had a decrease in creatinine of the same magnitude.  There was no significant difference between the number of patients who had increased creatinine versus decreased creatinine.  Kooiman 2014 reported similar results following contrast exposure: on average there were small decreases in creatinine, with similar numbers of patients experiencing increases or decreases in creatinine (figure below).  Unfortunately, the vast majority of studies focus only on patients with elevated creatinine, creating the illusion that contrast dye causes an increase in average creatinine.


    Another way to investigate the significance of changes in creatinine is to compare them to biomarkers of renal injury, for example neutrophil gelatinase-associated lipocalin (NGAL).  NGAL has been shown to rise rapidly and predict subsequent renal failure due to a broad variety of renal injuries, including cardiac catheterization.  Kooiman just published the largest study of biomarkers, describing 511 patients with chronic kidney disease who received contrast-enhanced CT scans.  These authors detected no change in two renal biomarkers (NGAL and KIM-1) following contrast administration.  This held true even in subgroups at higher risk for renal injury, including 36 patients with GFR<30 ml/min. 

    4% of patients in this study (20/501) met their definition of contrast nephropathy based on creatinine elevations.  However, there was no difference in biomarker levels between these patients and patients with stable creatinine levels.  This indicates that elevated creatinine among patients diagnosed with “contrast nephropathy” may simply reflects fluctuations in renal perfusion or vascular tone, rather than genuine kidney injury.

    (3) Does contrast dye effect patient-centered outcomes?

    Most descriptions of contrast nephropathy indicate that the creatinine peaks around three days after receiving contrast and then will often normalize within the next two weeks.  Supposing this is true, what is its clinical significance?  Ultimately patient-centered outcomes are what matters (e.g. dialysis and death).   

    There are many uncontrolledstudies in the literature showing that acute kidney injury following cardiac catheterization or contrasted CT scanning of hospitalized patients correlates with worse outcomes (e.g., death and dialysis; Weisbord 2011).  However, these studies lacked a control group that didn't receive contrast, and therefore fail to establish causality between contrast administration and kidney injury.  Indeed, within any group of sick patients, the development of renal failure prognosticates worse outcomes. 


    McDonald’s meta-analysis in 2013 of controlled studies did not find any relationship between contrast administration and death or dialysis.  However, as discussed earlier, these observational studies failed to account for confounding factors.  To address this, in 2014 McDonald performed a propensity-matching analysis involving 21,346 patients including 1,725 deaths and 52 dialysis initiations within 30 days of the CT scan.  Following propensity-matching, there was no independent relationship between these outcomes and contrast administration.  This study confirmed the correlation between AKI and mortality, but demonstrated that neither outcome is independently associated with contrast administration (figure below).  This debunks uncontrolled studies which attempted to imply causation between contrast administration, AKI, and mortality. 


    Conclusions

    For decades, the incidence and consequence of contrast nephropathy have been systematically inflated by poor research methodology.  For example:

    • Contrast nephropathy was defined in terms of small transient creatinine elevations, a definition which is sensitive but nonspecific.
    • Although contrast nephropathy is intended to be a diagnosis of exclusion, studies attribute all elevations in creatinine to contrast nephropathy, causing contrast to be blamed for every renal insult.
    • Most studies have been uncontrolled, based on the assumption that creatinine never changes in the absence of contrast dye.  
    • Among sick patients, renal failure correlates with mortality.  Studies of cohorts receiving contrast dye have replicated this correlation, with the implication that contrast was to blame for both renal failure and mortality.

    Among contrast dyes commonly used today, there is only evidence to support that Iohexol and Ioxaglate cause elevated creatinine.  This seems to be limited to patients with pre-existing renal dysfunction.  There is no convincing data that IOCM or safer LOCMs cause elevations in creatinine when used for CT scanning. 


    Contrast nephropathy has been defined in terms of short-term elevations in serum creatinine.  However, many patients meeting the definition of "contrast nephropathy" may merely have random fluctuations in serum creatinine.  A recent study revealed that outpatients with increased creatinine following contrast administration lacked elevations in the renal biomarkers, suggesting that these creatinine elevations may not reflect genuine kidney injury. 

    Ultimately, patient-centered outcomes such as dialysis or death are more important than transient fluctuations in creatinine.  By all accounts, these outcomes are far less common than transient elevations in creatinine.  Controlled studies have found no causal relationship between contrast dye and patient-centered outcomes.

    Of course, the absence of evidence does not constitute evidence of absence.  It is nearly impossible to prove that toxicity from a substance does not exist.  Thus, it remains possible that newer contrast agents could have some degree of nephrotoxicity.  In particular, there is little evidence regarding whether it is safe to use these agents in patients with severe renal failure.


    • Meta-analyses of RCTs comparing different contrast dyes demonstrate that some types of LOCM (especially Iohexol) cause creatinine elevation more often than others (table below).
    • There is no evidence that safer contrast dyes cause creatinine elevation.  The highest quality propensity-matched study of CT scans performed at the Mayo Clinic found no effect of contrast dye on renal function (of note, IOCM was used for patients at higher risk of renal failure).
    • "Contrast nephropathy" has been defined in terms of transient elevations in creatinine.  Its clinical significance is unclear.  There is no evidence that contrast dye causes patient-centered outcomes such as death or dialysis. 
    • One recent study found that outpatients with "contrast nephropathy" lack biomarker evidence of kidney injury.  This suggests that many studies of contrast nephropathy may have been measuring random fluctuations in creatinine rather than genuine kidney injury. 
    • Overall, there is currently no clear evidence of nephroticity due to IOCM or low-risk LOCMs (i.e., all except Iohexol and Ioxaglate).  However, it has not been excluded that they could pose a risk to patients with severe renal failure.  


    Notes

    (1) Unfortunately many investigators incorrectly assumed that all LOCM would have the same degree of nephrotoxicity, leading to multiple studies comparing IOCM to all types of LOCMs pooled together.  Most of these studies found no difference between IOCM and pooled LOCMs, leading to the incorrect conclusion that all LOCMs and IOCM are equivalent.

    (2) Actually there were a total of five propensity-matched studies released by two research groups (McDonald 2014,  McDonald 2013,  McDonald 2014, Davenport 2013, Davenport 2013).  This post focuses primarily on two papers which represent the most recent and most directly comparable analyses by each research group (indeed, it appears that the paper by McDonald 2014 was written as a direct retort to the publication by Davenport 2013).  Both series of papers are successive re-analyses of the same underlying data set. 

    (3) It is possible that differences between these two studies could relate to the type of contrast dye used.  Davenport's study used data from multiple hospitals which utilized different contrast dyes using various protocols (in 42% of cases the type of contrast dye was unknown).  McDonald's propensity-matching study was obtained using data from the Mayo Clinic, where Iohexol was utilized for patients at low risk of kidney injury and Iodixanol was utilized for patients at higher risk of kidney injury.  It is conceivable that the Mayo Clinic's systematic approach to selecting Iodixanol for higher-risk patients may have allowed them to avoid kidney injury. 

    (4) To make matters worse, there is no consistent definition of contrast nephropathy.  Different studies use a variety of definitions based on short-term elevations in creatinine (e.g. increase in Creatinine of >0.3 mg/dL, >0.5 mg/dL, >25%, >50%, or various combinations of these criteria).  Some papers present multiple analyses of the same data using different definitionsof contrast nephropathy, leading to conflicting conclusions (e.g., McCullough 2011). 

    (5)  The higher frequency of "contrast nephropathy" among patients with renal dysfunction could simply be due to the observation that patients with renal dysfunction have greater random variations in creatinine.  This likely reflects the shape of the curve relating creatinine to GFR, wherein small fluctuations in GFR cause greater variations in creatinine in the setting of renal dysfunction.  This is illustrated in the figure below.   Let us imagine, for the sake of argument, that occasionally any patient's GFR may fluctuate as much as +/-10 ml/min due to hydration status.   For a patient with normal renal function, this will cause minimal fluctuation in creatinine (blue arrows).   However, for a patient with renal dysfunction, this may cause substantial variation in creatinine (green arrows).


    COI & Disclaimers: I have no conflicts of interests (e.g., I receive no funds from drug, device, or imaging companies).  Opinions expressed herein are mine alone, and do not necessarily reflect the opinions nor policies of my employers or institution.  Additional disclaimers are listed here. 

    CT Angiogram for evaluation of severe hematochezia

    $
    0
    0
    Introduction

    Gastrointestinal hemorrhage is a common reason for ICU admission.  The approach to severe upper GI bleeding is relatively straightforward (figure below).  A predictable approach facilitates planning ahead, and anticipating who needs to be contacted for help when. 


    Unfortunately, the approach to severe hematochezia is often less clear.  Below is a description of how these cases often unfold.  The diagnostic evaluation is frequently inconclusive.  Fortunately, most cases of lower GI bleeding are due to diverticulosis or angiodysplasia and these generally stop without specific intervention.


    Building Blocks: Performance of various tests

    Diagnostic Nasogastric Lavage

    Historically, diagnostic NG lavage has often been over-utilized in a broad range of patients with GI bleeding.  For example, a recent article described the low yield of NG lavage in patients presenting with melena (Kessel 2015).  To confuse matters further, most studies of NG lavage have combined patients presenting with either melena or hematochezia.  Patients with an upper GI bleed presenting with hematochezia have a much brisker bleed than patients presenting with melena, and thus NG lavage might be expected to have a higher sensitivity in hematochezia.

    Byers 2007 performed a prospective observational study of patients presenting to the emergency department with hematochezia who underwent NG lavage.  Among 114 patients, 10% had a positive lavage and this had a high specificity for correctly identifying an upper GI source as confirmed upon endoscopy.  Although this study does not define the sensitivity of NG lavage, it supports that NG lavage may have reasonable yield and high specificity in this context. 

    The sensitivity of NG lavage among patients presenting with hematochezia has not been studied.  Based upon pooled studies of NG lavage of diverse presentations of GI bleeding, an estimate might be 50% (Palamidessi 2010).  Duodenal bleeding can be missed.  The specificity depends on the quality of material removed by the NG tube; a lavage demonstrating blood or coffee-grounds has a positive likelihood ratio of ~10 for upper GI bleeding (Srygley 2012). 

    The primary drawback of NG lavage is that it is very uncomfortable, although this can be alleviated with topical anesthesia (e.g., see the ALIEM blog).  However, it has the advantages of being fast and inexpensive, with a reasonable yield and specificity (Anderson 2010). 

    Esophagogastroduodenoscopy (EGD)

    EGD is potentially one of the more important tests in evaluation and management of hematochezia.  10-15% of patients with severe hematochezia may have an upper GI source with rapid intestinal passage.  EGD has high sensitivity for identifying these patients and also allows for immediate therapy. 

    EGD does not have perfect specificity due the rare occurrence of multiple sources of bleeding.  For example, a patient may have a minor gastric ulcer combined with active diverticular hemorrhage.  There may be a risk of finding the gastric ulceration and ceasing further diagnostic efforts ("satisfaction of search"). 

    The main drawback of EGD is that it is an invasive test requiring conscious sedation, a gastroenterologist, and an endoscopy nurse.  Logistically this may take anywhere from 30 minutes to several hours to organize.  Given that most patients with hematochezia will nothave an upper GI source, this can cause significant delays in arriving at the correct diagnosis. 

    Colonoscopy

    Unlike the stomach and upper gastrointestinal tract, it is difficult to suction and clear the colon of blood and stool during active bleeding.  Therefore, for a critically ill patient with active hemorrhage, colonoscopy will often be impossible or nondiagnostic.  Some studies and guidelines recommend emergent colonoscopy for patients with lower GI bleeding, either without bowel preparation or following emergent preparation.  However, in our experience, this doesn't seem to work well and is not utilized for severehematochezia. 

    Tagged RBC scan

    Tagged RBC scan is frequently unhelpful.  Its use in an emergency is limited due to time required to set up the study and acquire images.  Even when it is positive, the image produced by extravasated blood is often unclear and doesn't locate the bleed with certainty.  Up to 25% of bleeding scans suggest an incorrect location of bleeding, due to rapid luminal migration of blood (Ghassemi 2013).  Tagged RBC scans have already been replaced by CT angiography at several centers (ASGE Guideline 2014). 

    jjj
    CT Angiography (CTA) 


    Advances in multi-detector helical CT scanning have allowed for the development of an IV contrasted CT scan which is highly accurate for locating bleeding anywhere along the GI tract.  CTA typically consists of a series of three scans: an unenhanced CT scan of the abdomen, an arterial-phase contrasted CT scan, and a delayed venous-phase CT scan.  Together, these scans provide a wealth of information about the patient's anatomy and the location and character of any bleeding.  Meta-analysis revealed a sensitivity of 85% and specificity of 92% for identifying the bleeding source (Garcia-Blazquez 2013).  With severe active bleeding the performance is better (sensitivity >90%; Geffroy 2011) .  CTA has five major advantages compared to more traditional approaches:

    (1) Detection and characterization of obscure bleeding sites

    CTA has the ability to identify common sources of bleeding (both upper and lower) as well as more obscure sources of bleeding (e.g., aortoenteric fistula, small bowel sources, hemobilia).  It may also provide information characterizing an underlying lesion (e.g. identification of diverticula, tumors, etc.).  For example, the following images are from a CTA obtained in a patient with hemobilia due to a gangrenous gallbladder.  CTA localizes bleeding to the gallbladder and also characterizes underlying biliary and vascular pathology, expediting appropriate management (in this case, cholecystectomy). 


    (2) Diagnosis of other abdominal pathologies that present with hematochezia

    Patients presenting with hematochezia and shock are generally assumed to have hemorrhagic shock.  However, a variety of disorders can mimichemorrhagic shock, for example infectious colitis causing septic shock, ischemic colitis due to cardiogenic shock, or mesenteric ischemia causing systemic inflammatory response syndrome.  CTA will rapidly reveal these intestinal pathologies, immediately re-directing the management of these patients.


    (3) Speed and availability

    Aside from NG lavage, CTA is often the fastest and most available study.  Only intravenous contrast is utilized, so this test may be performed in the emergency department in under 10 minutes (Copland 2010).  For a critically ill patient, this may facilitate immediate triage to a curative procedure (e.g., angiography), rather than performing a series of time-consuming tests (e.g. EGD first, then tagged RBC scan second when EGD is negative, then angiography third).

    "CTA should be the standard of care for assessment of patients presenting with acute lower GI bleed"
    - Chan et al. 2014,  John Radcliffe Hospital, Oxford UK.

    (4) Ability to target invasive angiography or surgery

    When positive, CTA reveals the location and often the precise vascular anatomy leading up to the lesion.  This may facilitate the speed and success of a subsequent invasive angiography procedure to embolize the bleeding site.  If surgical resection is required, it may provide an adequate level of certainty that the surgeon will resect the appropriate segment of bowel.  Tagged RBC scans do not provide this level of precision.  


    (5) Immediate prognostication and triage

    CTA cannot detect very slow bleeding (i.e., < 0.3-0.5 ml/min).  Thus, although CTA may miss some cases of bleeding, it will miss the slowestsources of bleeding.  Indeed, although a negative scan doesn't reveal the source of bleeding, it still provides useful prognostic information. 

    Lower GI bleeding has a mortality rate of 2-4%, significantly lower than upper GI hemorrhage.  Nonetheless, hematochezia may be quite visually impressive and this can provoke anxiety leading to over-transfusion and unnecessary ICU admission.  A negative CT angiogram may be a helpful clue that bleeding may have stopped spontaneously.  Chan 2014found that among patients presenting with lower GI bleeding and negative CTA, 77% had no recurrence of bleeding.  Thus, a patient with a negative CTA who is otherwise stable may be appropriate for admission to the ward rather than the ICU.


    Drawbacks: Safety concerns

    CTA does involve exposure to contrast dye, and if the patient requires invasive angiography this will involve two contrast exposures.  However, the existence of contrast nephropathy with modern contrast dyes is questionable (discussed further here).  CTA requires 100-125ml of IV contrast, which for comparison is less than half of what may be required for a complex cardiac catheterization procedure (Artigas 2013).  Overall, if the patient does not have severe renal failure and a safer contrast dye is utilized, this is unlikely to cause a problem.

    CTA does also involve radiation exposure, which is concerning primarily among younger patients.  Younger patients overall are more likely to have an upper GI source of hemorrhage (most causes of lower GI bleeding such as diverticular bleeding and angiodysplasia become more common with age).  Therefore, it may be reasonable to try to utilize EGD rather than CTA as the initial test for younger patients, on the basis of both yield and avoidance of radiation exposure.

    Invasive Angiography

    Angiography is one of the most useful procedures for lower GI bleeding.  It has the capability to diagnose the source of bleeding, although this requires a faster bleeding rate compared to CTA (e.g., >0.5-1 ml/min) rendering it somewhat less sensitive.  Most importantly, it can provide therapeutic embolization. 

    Angiography is usually not used as an initial test, except in cases of exsanguinating lower GI bleeding.  Without knowledge of where the bleeding is coming from (e.g. based on CT angiography or endoscopy), blind angiography is harder to perform as this requires sequential injection of multiple arteries searching for the bleed.  Angiography also requires mobilization of an interventional radiologist and the interventional radiology suite, which further limits its ability to be used as a first-line investigation.

    Proposed approach


    Above is flexible approach to severe hematochezia incorporating CT angiography and clinical judgment.  This is not truly "new," as various CTA-based approaches have been advocated for several years and are already utilized in many centers (e.g. Copland 2010).  However, knowledge translation has often been sluggish. 

    The first goal of the algorithm is evaluating for upper GI hemorrhage, since these patients have the highest mortality and benefit most from intervention.  For patients at high likelihood of upper GI hemorrhage, it is sensible to proceed directly to EGD (as is currently recommended in many algorithms for all patients with hematochezia).  However, older patients without risk factors for upper GI bleed probably have a rate of upper GI bleed <10%.  If such a patient has a negative NG lavage, then their risk of having an upper GI bleed may be <5%.  At that pre-test probability, it may make more sense to proceed to CTA rather than EGD.  Mis-directing a patient with upper GI bleed to CTA should not cause the upper GI bleed to be missed for too long, since CTA is sensitive for upper GI bleeding as well as lower GI bleeding (1).

    This algorithm eliminates both colonoscopy and tagged RBC scan from the initial approach to severe hematochezia (similar to the algorithm by Marion 2014).  Both of these tests are time-consuming and often low-yield.  Delaying other tests may allow intermittent bleeding sources to stop, reducing the diagnostic yield.  In contrast, CTA provides immediate information about the rate and location of bleeding anywhere in the GI tract. 

    This algorithm does utilize NG lavage for some patients.  Some authors have recommended skipping NG lavage and proceeding directly to CT angiogram (Sun 2012).  However, NG lavage may occasionally be useful because if positive it will facilitate expedited management (allowing omission of CTA and proceeding directly to endoscopy).  A reasonable approach might be to try passing an NG tube with topical analgesia, but if this is not tolerated or unsuccessful not to persist with excessive attempts at NG passage.


    • Abdominal CT angiography is a fast test with high performance to reveal bleeding anywhere in the GI tract.  CTA has already replaced tagged RBC scanning in many centers.
    • An approach incorporating physician judgment, NG lavage, and CTA may allow for thorough evaluation of hematochezia without subjecting every patient to an upper endoscopy (EGD).
    • In situations where endoscopy is not immediately available, CTA may allow for rapid and accurate evaluation of hematochezia.  This may help identify which patients require immediate intervention and which patients can be safely observed.  


    This post was co-authored with Dr. Paul Farkas, my father and senior consultant in Gastroenterology. 

    Additional Reading
    ...
    • Copland A et al.  Integrating urgent multidetector CT scanning in the diagnostic algorithm of active lower GI bleeding.  Gastrointestinal Endoscopy, 2010; 72(2) 402-405.
    • Artigas JM et al.  Multidetector CT angiography for acute gastrointestinal bleeding: Technique and findings.  Radiographics 2013; 33: 1453-1470.

    Notes

    (1) Additionally, an upper GI bleed with a negative NG lavage presenting with hematochezia is likely to represent a penetrating duodenal ulcer (often involving the gastroduodenal artery).  It is not uncommon for this type of ulcer to fail to respond to therapy by EGD and require angiography.  Therefore, obtaining a CTA in this situation is not necessarily the "wrong" approach but instead it may prove useful in guiding angiography if EGD fails to achieve hemostasis.


    Viewing all 104 articles
    Browse latest View live