Introduction
The limitations of p-values for null hypothesis testing has been debated since their invention in the 1920s.
Unfortunately, statistics textbooks typically whitewash this controversy, presenting null hypothesis testing as the only viable approach to statistics.
Recently, the journal of Basic and Applied Social Psychology took this debate a step further,
officially banning the use of
p-values in any manuscript.
This is an eye-opening move, which invites serious re-evaluation of the
p-value.
This post starts by exploring five major problems with the p-value. It will then discuss six ways that we can try to interpret p-values in a meaningful way.
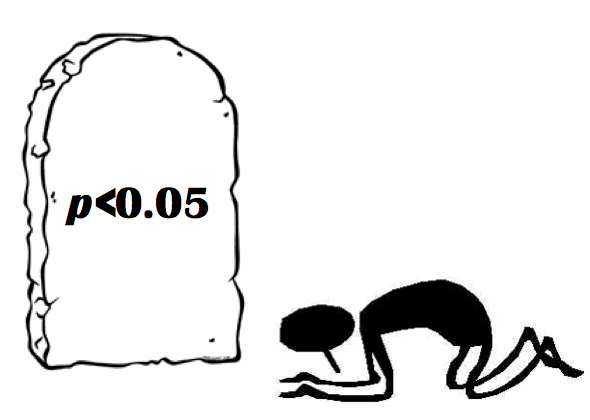
Five problems with the p-value
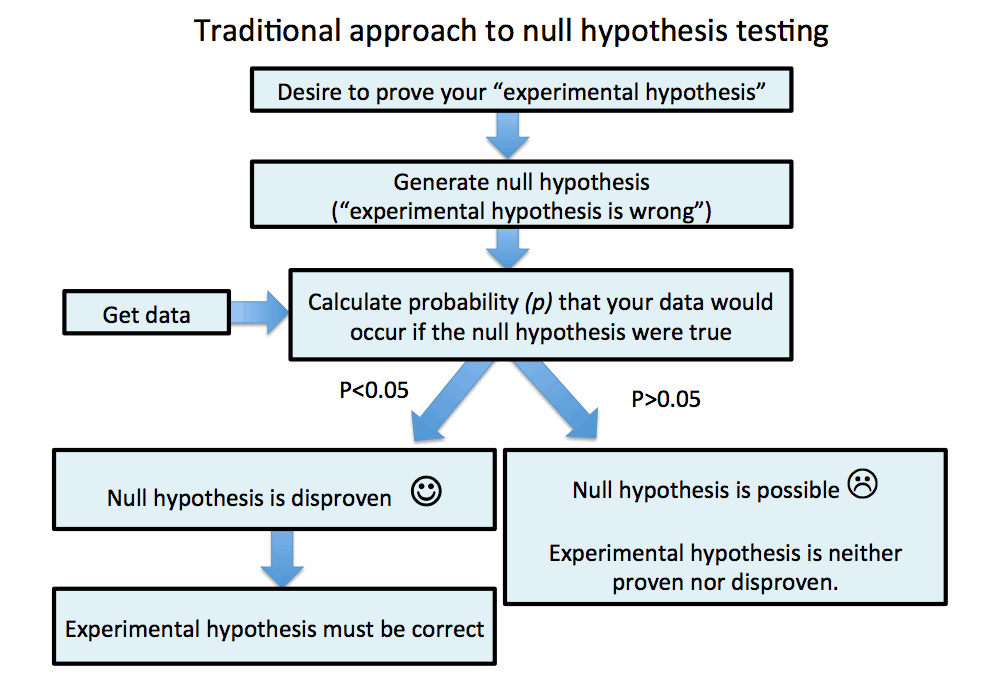
[Problem #1] P-values attempt to exclude the null hypothesis without actually showing that the alternative is much better.
The p-value attempts to prove an experimental hypothesis by disproving the alternative (the "null hypothesis") as shown below. The experimental hypothesis is thus proven by a process of exclusion:
Unfortunately, this is fundamentally flawed. Statistics cannot absolutely exclude the null hypothesis (p=0), but rather it may merely show that the observed data would be unlikely to occur (p<0.05) if the null hypothesis were true (2). It is subsequently assumed that the observed data would be much more likely if the experimental hypothesis was true.
However, there is no guarantee that the experimental hypothesis fits the data much better than the null hypothesis. Maybe the data is just really wacky. Perhaps the data doesn't fit any hypothesis very well. By only comparing the data to one of these possibilities (the null hypothesis) the standard approach to null-hypothesis testing only evaluates one side of the balance:
[Problem #2] The P-value ignores pre-test probability
Let's imagine that a homebound elderly woman is admitted in Vermont USA for constipation. By accident, a serologic test for Ebola is ordered and it comes back as positive. The test has a specificity of 99.9%. However, the patient has no signs of Ebola nor any possible contact with Ebola. Any sensible clinician would realize that this is a false-positive test. However, technically this is a highly "statistically significant" result. Assuming the null hypothesis (that the woman doesn't have Ebola), this result would be expected 0.1% of the time (p=0.001). Based on the p-value, the woman must have Ebola!
This scenario highlights how the
p-value ignores pre-test probability.
If the hypothesis is highly unlikely to begin with, even a strongly positive statistical test may not render the hypothesis probable.
Alternatively, if a hypothesis is very likely to begin with, then even a weakly positive statistical test may render it probable.
Any statistical test is meaningless without considering the pre-test probability (
Browner 1987).
[Problem #3] P-values actually tell us the reverse of what we want to know
The p-value tells us the likelihood of observing the data, assuming that the null hypothesis is correct. This is actually the reverse of what we want to know: What is the likelihood of the null hypothesis given the observed data?
For example, in the above situation, the p-value tells us the likelihood that an Ebola serology will be positive, assuming that the patient doesn't have Ebola (p=0.001). This evadesthe question that we are truly interested in: What is the likelihood that the patient has Ebola, given that she has a positive Ebola serology?
Although these reversed conditional probabilities may sound deceptively similar (the probability of Agiven B versus the probability of B given A), they are entirely different. For example, to get from one conditional probability to the other, Bayes Theorem is required (neon sign below). Failing to recognize this difference leads the widely held misconception that the p-value is equal to the probability that the null hypothesis is true.
[Problem #4] P-values are not reproducible
One of the bedrock principles of science is that any meaningful result must be reproducible. Anything which is not reproducible is not scientific.
We've all probably experienced the phenomenon where adding or subtracting a few data points will move the
p-value across the
p=0.05 goal-post.
What is even more disquieting is that when the
entire experiment is repeated, the
p-value varies much more (
Halsey 2015).
As the confidence interval slides around with repetition of the experiment,
p-values rise and fall
exponentiallybased on how closely the confidence interval lands to zero (illustrated in the video below).
The
p-value seems less like a sober and reproducible feature of science, and more like a random gamble.
[Problem #5] The P-value is generally used in a dogmatic and arbitrary fashion
The use of the p-value has grown into something arbitrary and nonsensical. If p=0.051, then the result is "insignificant", a mere "trend" in the data which is easily dismissed. However, if one data point is added causing a drop to p=0.049 then the result is suddenly, magically significant. It was not meant to be this way. When the p-value was designed in the 1920s, it was intended as a flexible tool to determine whether an experiment was worth repeating and investigating further. It was never conceived to represent absolute truth.
Six ways to avoid being misled by P-values
It's easier to be critical than to be productive.
Critiquing the
p-value is the easy part.
The five problems listed above are not close to being exhaustive (for example, one article listed a dozen problems with the
p-value;
Goodman 2008).
The real challenge is determining how to move forward given this knowledge. Bayesian statistics are emerging as a viable alternative to the p-value (more on this below), but for now p-values are everywhere. What approaches can we use to interpret p-values without being misled?
[Solution #1] Re-scale your interpretation of the p-value
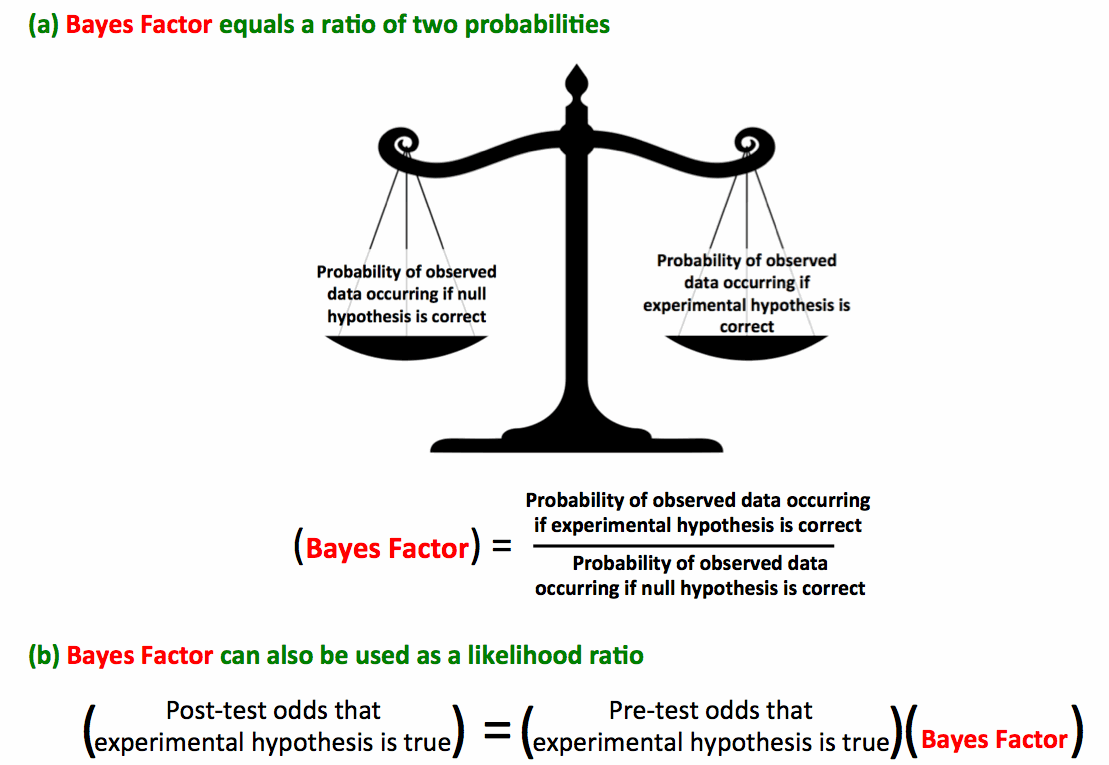
The p-value evaluates the null hypothesis in a vacuum. Perhaps the null hypothesis doesn't fit the data well, but how much better does the experimental hypothesis fit the data? This question is answered using Bayesian statistical methods. The key to this analysis is the Bayes Factor, which equals the ratio of these two probabilities (figure below). The Bayes Factor also equals the likelihood ratiorelating the pre-test and post-test odds of the experimental hypothesis being true. Neat.
Johnson 2013 evaluated a variety of standard statistical tests, correlating the
p-value with the Bayes Factor:
Therefore if
p=0.05, the odds of the experimental hypothesis being valid increase by a factor of roughly 3-5 (e.g., if the pre-test probability was 50%, the post-test probability will increase to 75%-83%)(3).
Thus
p=0.05 reflects a
moderatestrength of evidence, not definitive proof as is commonly believed.
Other investigators have obtained similar results using different Bayesian techniques (
Goodman 2001).
These correlations are rough approximations.
Ideally, the Bayes Factor would be calculated directly from the data in each study (
Jakobsen 2014).
However, in the absence of such calculations, these correlations may help understand the meaning of various
p-values.
[Solution #2] Consider the pre-test probability.
The post-experiment odds that the experimental hypothesis is true may be calculated using the Bayes Factor as a likelihood ratio as shown above (3). As in clinical testing, a statistical test alone is meaningless without taking into account the pre-test probability. This equation allows for a seamless combination of pre-test probability with the experimental data. Notably, the final result is equally dependent on both of these factors.
Unfortunately, it pre-test probability is often unclear. The appropriate pre-test probability for clinical trials has been debated previously with no clear answer. The principle of indifference suggests that in a state of ignorance, the pre-test probability should be given a 50% likelihood. However, in the history of medicine, most therapies which were investigated have proven to be ineffective. Therefore, utilizing a pre-test probability of 50% may be too generous in most cases. Ideally the pre-test probability may take into account the prior evidence basis supporting the hypothesis (i.e. basic science, animal data, prior clinical studies) and the success rate of similar hypotheses.
Estimating pre-test probability might seem to add an element of subjectivity which threatens the "objective" results of statistical testing. However, failing to consider pre-test probability is even more dangerous, because this implicitly confers 50% pre-test probability to every hypothesis (1). One advantage of a Bayesian approach is that by providing the Bayes Factor, it allows the reader to calculate the post-test probability based on their own pre-test probability and draw their own conclusions.
Ultimately this provides us with a disappointing realization: It is generally impossible to determine the probability that the experimental hypothesis is correct. This probability depends on the pre-test probability, which is usually unknown. Thus, the final probability of the experimental hypothesis being valid is a known unknown. Statistical tests help point us in the right direction, but they cannot definitively reveal the truth.
[Solution #3] Always bear in mind that the p-value does not equal α (type-I error)
Type-1 error (
α) is the risk of incorrectly discarding the null hypothesis, and thereby incorrectly accepting the experimental hypothesis.
One very common misconception is that the
p-value equates with
α (i.e., if p<0.05 then
α<0.05).
This misconception is due to equating conditional probabilities (discussed above in Problem #3). In practice, p is often lower than
α.
For example, some authors suggest that hypotheses which are "significant" near the
p=0.05 level have a >20% likelihood of being wrong (
α>0.2;
Goodman 2001,
Johnson 2013).
[Solution #4] Consider modifying the acceptable Type-I error (α) based on clinical context
Conventionally, the acceptable level of type-I error (α) is set to the magical value of α<5%. However, this doesn't always make clinical sense. Consider two imaginary hypotheses:
Hypothesis #1: New treatment for septic shock using early goal-directed intra-cranial pressure monitoring reduces mortality (α=0.04)
Hypothesis #2: Vitamin C supplementation improves healing of pressure ulcers (α=0.1)
Placing intra-cranial pressure monitors is invasive. Therefore, although Hypothesis #1 does indeed have α<0.05, I would be unwilling to broadly implement this before replicating it with another study. Alternatively, vitamin C supplementation is very safe, so I would be willing to prescribe this therapy despite a lower level of certainty (α=0.1).
Ultimately as clinicians, we must weigh the relativelikelihood of harm vs. benefit as well as the relativeamount of harm vs. benefit. The statistical tests described in this post pertain primarily to the likelihood that the therapy is beneficial (Type-I error, α). However, when weighing a clinical decision this is only one of four important pieces of information (figure above). Depending on the clinical context, different levels of Type-I error may be clinically acceptable.
[Solution #5] Evaluate the P-value in the context of other statistical information
When examining a study, the entirety of the data should be considered rather than focusing only on the p-value. In particular, effect size, confidence intervals, sample size, and power may be important. For example, consider the two results shown below regarding benefit from an experimental therapy. Although both have the same p-value, their interpretation is quite different. The results on the right may suggest that the therapy is ineffective, whereas the results on the left may suggest that the study was underpowered and additional evidence is needed to clarify the true effect.
[Solution #6] Don't expect statistics to be a truth machine
We live in a fast-paced society, deluged by information. We want quick answers. Is the study positive or negative? Is the drug good or bad? Quick, what is the bottom line? The arbitrary dividing line of p=0.05 is a quick, but extremelydirty approach to this. This concept of a single cutoff value yielding a binary result (significant vs. insignificant) is based on the misconception that statistical tests are some sort of "truth machine" which must yield a definitive result.
![]()
In reality, statistical tests never tell us with 100% certainty whether a hypothesis is true. As discussed above, statistical tests cannot even tell us the absolute probabilityof the hypothesis being true. Statistical tests can only provide us with likelihood ratios which may increase or decrease our belief in the hypothesis. It is our job to interpret these likelihood ratios, which often requires a lot of work. Rarely statistical tests may yield dramatic results, but more often they result in shades of grey. We must be willing to accept these shades of grey, and work with them. We must have patience to perform more experiments and invest more thought, before reaching a conclusion.
Conclusions
P-values are deeply entrenched in the medical literature. Based initially on a suggestion by Fisher in 1920s, hypotheses with p<0.05 are accepted whereas hypotheses with p>0.05 are rejected. It is widely believed that the p-value measures the likelihood of the null hypothesis and the reproducibility of the experiment. Unfortunately, none of these beliefs are true.
The harsh reality is that our statistical tests aren't nearly as definitive as is commonly thought. A p-value of 0.05 may actually correlate with a likelihood ratio of 3-5 that the hypothesis is correct, which constitutes only moderately strong evidence. P-values are notoriously variable, providing no information about the reproducibilityof the result. Furthermore, the final probability that the hypothesis is correct is strongly dependent on the pre-test probability, which is often ignored.
Change is difficult, particularly regarding something as pervasive as the p-value. Demanding more statistically rigorous results may be impossible for investigators, particularly in critical care studies where recruitment is difficult. Ultimately we may have to accept that studies aren't the statistically all-powerful truth machines which we have believed them to be. In the face of weaker statistical evidence, we may need to proceed more cautiously and with greater emphasis on pre-test probability (e.g. integration with prior evidence), statistical context (e.g. effect size and power), and alpha-levels adjusted based on clinical context. The truth machine is broken: welcome to the grey zone.
- P-values over-estimate the strength of evidence. Research using Bayesian Statistics suggests that p=0.05 corresponds to a positive likelihood ratio of only 3-5 that the experimental hypothesis is correct.
- P-values are very poorly reproducible. Repeating an experiment will often yield a dramatically different p-value.
- Any approach to hypothesis testing should take into account the pre-test probability that the hypothesis is valid. Just like a laboratory test, a statistical test is meaningless without clinical context and pre-test probability.
- Avoid blindly using conventional cutoff values (e.g., p<0.05 and α<0.05) to make binary decisions about the hypothesis (e.g., significant vs. nonsignificant). Life just isn't that simple.
References of particular interest
- Goodman SN. Toward evidence-based medical statistics Part 1: The P-value fallacy. Ann Intern Med 1999; 130: 995-1004, as well as adjacent article Part 2: The Bayes Factor1005-1013.
- Goodman SN. A dirty dozen: Twelve p-value misconceptions. Semin Hematol 2008; 45: 135-140.
- Johnson VE. Revised standards for statistical evidence. Proceedings of the National Academy of Science, 2013; 110 (48) 19313-19317.
- Halsey LG et al. The fickle P value generates irreproducible results. Nature Methods 2015; 12(3) 179-185.
Notes
(1) Standard null-hypothesis testing using the p-value does not explicitly assign any pre-test probability to the null hypothesis or the experimental hypothesis. Supporters of p-values would argue that this is an advantage of null-hypothesis testing, allowing the procedure to avoid the slippery issue of pre-test probability. However, the entire procedure of null-hypothesis testing entirely ignores the pre-test probability and applies similar rigor for testing every hypothesis. By ignoring the pre-test probability, this procedure indirectly implies that it is unimportant (i.e., doesn't significantly differ from 50%).
(2) The p-value is actually the likelihood of obtaining the observed result or any more extreme result based on the null hypothesis. This nuance is left out of the body of the text merely for the sake of brevity. The distinction may be a real issue, however, because the p-value is not a measurement of the data itself but actually a measurement of more extreme data. Since the precise distribution and nature of this extreme data is generally not known (but rather inferred), this can lead to incorrect results.
(3) Unfortunately, likelihood ratios and Bayes Factors are defined in terms of odds, but in general it's easier to think about things in terms of probabilities. Odds and probabilities can be easily converted to one another, although this gets tiresome. The fastest way to convert a pre-test probability into a post-test probability using the Bayes Factor (or a Likelihood Ratio) is via an online statistical calculator.